Factors include protein, water quality, stocking density, daily ration size and feeding frequency

Protein is typically the most expensive macronutrient in shrimp feeds, and determination of the optimal protein level is important for formulating cost-effective feeds. Little information is available on protein requirement during the early postlarval stage of Pacific white shrimp (Litopenaeus vannamei). Here we report the results of a study to determine the optimal dietary protein level for postlarvae of this species held in a recirculating culture system.
Experimental setup

Hatchery-reared L. vannamei PL7- PL10 (mean weight 0.95 to 1 mg) were stocked at 1.5 PL per liter (or 444 PL per square meter) in 20 l of water in fiberglass tanks with six to seven replicate tanks per treatment. These tanks were part of a closedrecirculating culture system equipped with a water pump, a fine sand filter, submerged and trickling biofilters, a heat exchanger, a 50-mm cartridge filter, and UV lights. Water exchange in each tank was approximately 125 percent per hectare. A photoperiod of 12 hours of light and 12 hours of dark was maintained with cool fluorescent tubes. PL were fed every 96 min with automatic feeders during the 20-day experimental period.
Experiment 1

In the first experiment, six semipurified diets were formulated to contain 10, 18 and 25 percent dietary protein with either 3 or 11 percent lipid level (Table 1). Graded levels of protein were achieved by replacing wheat starch with wheat gluten and soybean protein isolate. Lipid level in the feed was modified mainly by replacing acid-washed diatomaceous earth with fish oil.
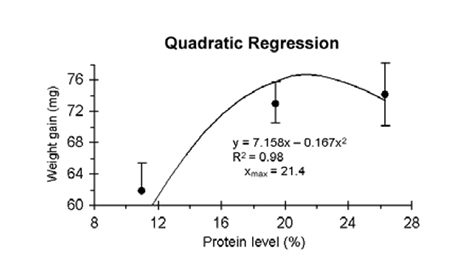
Mean PL survival (Table 3) ranged from 66 percent to 92 percent. Survival was not significantly affected by protein level, but was significantly lower for diets containing 11 percent lipid. Quadratic regression analysis of weight gain data indicated the optimal protein level to be 21.4 percent, while broken-line analysis indicated 20.2 percent (Fig. 1).

Experiment 2

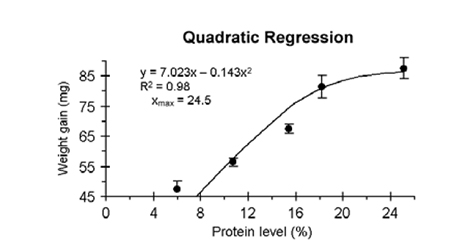
In the second experiment, five semi-purified diets were formulated to contain 5, 10, 15, 20 and 25 percent dietary protein, and 8 percent lipid level (Table 2). Mean PL survival (Table 4) of all treatments was high (93.3 to 98.9 percent). PL growth was significantly lower for diets containing 15 percent or lower protein compared to diets with 20 and 25 percent protein (Table 4). This indicates that essential amino acids were limiting at this protein level. Quadratic regression analysis of weight gain data indicated the optimal protein level to be 24.5 percent, while broken-line analysis indicated 21.5 percent (Fig. 2).


Conclusion
Two growth trials with postlarval L. vannamei using protein levels ranging from 5 to 25 percent yielded estimates of protein optima in the range of 20.2 to 24.5 percent. However, determination of optimum dietary protein level is also affected by the level of other components in the feed, such as protein and water quality, and experimental factors such as stocking density, daily ration size, and feeding frequency. The optimum protein level estimates found in this study are generally lower than those previously reported for larger size L. vannamei. Further research to optimize the protein-amino acid to energy ratio for this species should be conducted.
(Editor’s Note: This article was originally published in the December 2000 print edition of the Global Aquaculture Advocate.)
Now that you've finished reading the article ...
… we hope you’ll consider supporting our mission to document the evolution of the global aquaculture industry and share our vast network of contributors’ expansive knowledge every week.
By becoming a Global Seafood Alliance member, you’re ensuring that all of the pre-competitive work we do through member benefits, resources and events can continue. Individual membership costs just $50 a year. GSA individual and corporate members receive complimentary access to a series of GOAL virtual events beginning in April. Join now.
Not a GSA member? Join us.
Authors
-
-
A.L. Lawrence, Ph.D.
Texas A&M University System
Shrimp Mariculture Research
Laboratory
Port Aransas, Texas, USA -
F.L. Castille, Ph.D.
Texas A&M University System
Shrimp Mariculture Research
Laboratory
Port Aransas, Texas, USA -
L.G. Obaldo, Ph.D.
The Oceanic Institute
Waimanalo, Hawaii, USA
Tagged With
Related Posts

Health & Welfare
Broodstock shrimp nutrition, a review
Research into broodstock shrimp nutrition will be a key element in the further use of domesticated and genetically selected stocks for aquaculture.

Health & Welfare
Improving the osmoregulatory capacity of Pacific white shrimp grown in low salinity
Study shows it is possible to improve shrimp production in low-salinity waters by correcting magnesium and potassium deficiencies.

Health & Welfare
Fishmeal replacements: Rendered protein meals effective
Research indicates that rendered protein meals could replace significant amounts of fishmeal in diets for shrimp and several cultured fish species without reducing weight gain.

Health & Welfare
Protein-energy ratio research in penaeid shrimp
Of all the issues important to shrimp nutrition, the reduction of feed cost with concomitant increased feed performance are most desirable.


