Optimizing feed formulations can improve shrimp growth

Indoor super-intensive recirculating systems can produce large quantities of shrimp, but have high initial investment and operating costs. Feed typically accounts for more than 50 percent of the total production costs for shrimp culture. Optimization of feed formulations can significantly improve shrimp growth performance and minimize negative impacts on water quality.
Interactions among feed, water quality and productivity have been researched extensively in relation to super-intensive biofloc-dominated systems. The result has been the development of specially formulated feeds that enhance shrimp performance in limited-discharge systems.
Study setup

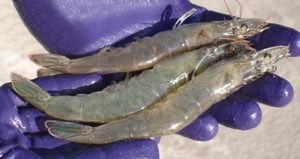
A 2013 study by the authors evaluated the use of a commercial feed (CF-35) and an experimental feed (EXP) formulated for super-intensive biofloc-dominated production of Litopenaeus vannamei in production systems at the Texas A & M AgriLife Research Mariculture Laboratory in Corpus Christi, Texas, USA, along with the economic aspects related to their use.
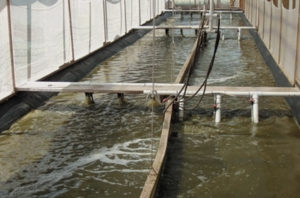
The 77-day study was conducted in six, 40-m3 raceways lined with ethylene propylene diene monomer and filled with a mixture of aged biofloc-rich water and fresh natural seawater adjusted to 30 ppt. The raceways were stocked at a density of 324/m3 with 4.7-g juveniles produced from a cross between fast-growth genetic lines and Taura-resistant breeding lines. There was no water exchange, only evaporation replenishment.
The CF-35 feed was formulated to contain 35.78 percent crude protein, 8.72 percent lipid, 1.91 percent fiber and 9.61 percent ash, while the EXP feed had 39.54 percent protein, 9.19 percent lipid, 3.00 percent fiber and 12.32 percent ash. The study compared the two feeds with three replicates each.
Results
Production and preliminary financial results for each feed treatment are presented in Table 1. No significant difference was found between the treatments except for survival, which was higher for the CF-35 feed, which contained a bioactive natural additive. The high feed-conversion values observed suggested negative impacts from infections by Vibrio parahaemolyticus and/or V. alginolyticus, V. owensii and/or V. communis, as confirmed by histology. Harvested shrimp showed little if any sexual maturity and very little sex-related size variations.
Hanson, Production results for shrimp fed commercial or experimental diets, Table 1
| Production Metric | CF-35 | EXP |
|---|
Production Metric | CF-35 | EXP |
|---|---|---|
| Stocking density (shrimp/m3) | 324 | 324 |
| Survival rate (%) | 93.1 | 83.4 |
| Growth rate (g/week) | 2.05 | 2.16 |
| Stocking size (g) | 4.7 | 4.7 |
| Harvest size (g) | 27.2 | 28.8 |
| Feed-conversion ratio | 1.59 | 1.72 |
| Crop period (days) | 77 | 77 |
| Production (kg/m3) | 8.21 | 7.79 |
For the economic analysis, study results were extrapolated to a single greenhouse system that consisted of eight, 500-m3 grow-out tanks and two, 500-m3 nursery tanks. For this analysis, the initial capital investment for the greenhouse was $991,997. Other costs included shrimp sale prices of $7.19/kg and $8.80/kg, CF-35 grow-out feed at $1.923/kg ($1,923/mt), and the EXP diet at $1.945/kg ($1,945/mt). The juvenile production cost was U.S. $20/1,000, and there was an 8 percent interest rate for loans.
From these figures, a 10-year cash flow based on production trial results was used to develop an enterprise budget that calculated the shrimp production costs and net returns, net present value, internal rate of return and payback period.
Table 2 presents the production performance with the two diets in the greenhouse scenario. The CF-35 diet produced 1,745/kg more crop than the EXP diet, and for the year, the former diet produced 8,203 kg more.
Hanson, Extrapolated shrimp production and sales for shrimp fed commercial or experimental diets, Table 2
| CF-35 | CF-35 | EXP | EXP |
|---|
CF-35 | CF-35 | EXP | EXP | |
|---|---|---|---|---|
| Selling price (U.S. $/kg) | 7.19 | 8.80 | 7.19 | 8.80 |
| Production (kg/crop) | 32,624 | 32,624 | 30,879 | 30,879 |
| Annual crops | 4.7 | 4.7 | 4.7 | 4.7 |
| Annual production (kg) | 153,334 | 153,334 | 145,131 | 145,131 |
| Annual production (mt) | 153.3 | 153.3 | 145.1 | 145.1 |
| Total annual sales (U.S. $ million) | 1.10 | 1.35 | 1.05 | 1.28 |
Economics
The annual production for the CF-35 feed treatment amounted to $1.10 million and $1.35 million in sales at the $7.19/kg and $8.80/kg shrimp selling prices. For the EXP diet, sales were $1.05 million and $1.28 million at the $7.19 and $8.80/kg selling prices. The CF-35 feed had a positive net return at the lower selling price compared to a negative net return for the EXP feed (Table 3). The cost of production for the CF-35 feed was $6.71/kg of shrimp produced, and the production cost for the EXP feed was $7.22/kg.
Hanson, Extrapolated production budget and financial indicators of profitability for shrimp fed commercial or experimental diets. Table 3
| CF-35 | CF-35 | EXP | EXP |
|---|
CF-35 | CF-35 | EXP | EXP | |
|---|---|---|---|---|
| Enterprise budget items (U.S. $/kg) | ||||
| Gross receipts | 7.19 | 8.80 | 7.19 | 8.80 |
| Variable costs | 5.43 | 5.43 | 5.87 | 5.87 |
| Income above variable costs | 1.76 | 3.37 | 1.32 | 2.93 |
| Fixed cost | 1.28 | 1.28 | 1.34 | 1.34 |
| Total expenses | 6.71 | 6.71 | 7.21 | 7.21 |
| Net return | 0.48 | 2.09 | -(0.02) | 1.59 |
| Payback period (years) | 4.5 | 2.0 | 11.1 | 2.5 |
| Net present value (U.S. $ million) | 0.1 | 1.7 | -0.7 | 1.1 |
| Rate of return (%) | 12 | 38 | -1 | 29 |
Using the 77-day experiment time as the production period for 4.7 crops/year assumes a year-round supply of postlarvae is available and back-to-back production is feasible in these systems. Given these assumptions, the 2.0-year payback period for the CF-35 feed treatment at the higher shrimp selling price was shortest, and the 11.1 years for the EXP feed treatment at the lower shrimp selling price was longest.
The net present value (NPV) figures calculated over a 10-year period had a similar order, with $1.7 million NPV for the CF-35 feed and $8.80/kg selling price and $0.7 million NPV for the EXP feed and $7.19/kg price. The internal rates of return (IRR) followed suit with a 38 percent and 29 percent IRR for the CF-35 and EXP feed treatments at the $8.80/kg shrimp selling price and a lower IRR for the CF-35 feed treatment selling at $7.19/kg.
(Editor’s Note: This article was originally published in the May/June 2014 print edition of the Global Aquaculture Advocate.)
Authors
-

Terry R. Hanson, Ph.D.
School of Fisheries
Aquaculture and Aquatic Sciences
203 Swingle Hall
Auburn University
Auburn, Alabama 36849 USA -
Leandro F. Castro, M.S.
Instituto de Ciências do Mar
Fortaleza, Ceará, Brazil -

Thomas R. Zeigler, Ph.D.
Zeigler Brothers, Inc.
Gardners, Pennsylvania, USA -
Timothy A. Markey
Zeigler Brothers, Inc.
Gardners, Pennsylvania, USA -
Tzachi M. Samocha, Ph.D.
Texas A&M University
AgriLife Research Mariculture Laboratory
Corpus Christi, Texas, USA
Tagged With
Related Posts

Intelligence
An inside look at Sino Agro Foods’ giant prawn MegaFarm
Sino Agro Foods has developed a proprietary recirculating aquaculture system that yields high production volumes and profitability. The facility should significantly contribute to seafood production in China and to help satisfy increasing demand for high value, safe and sustainably produced seafood.

Innovation & Investment
Brazilian shrimp farmers eye new horizons
After concentrating mainly on the domestic market, the Brazilian Shrimp Farmers Association says producers are returning to international trade and competition, seeking intensified production and expansion.

Aquafeeds
A new nutrient for aquaculture, from microbes that consume carbon waste
Biotechnology firm NovoNutrients aims to produce a line of nutraceutical aquafeed additives as well as a bulk feed ingredient that can supplement fishmeal. Its process includes feeding carbon dioxide from industrial gas to a “microbial consortium” starring hydrogen-oxidizing bacteria.

Health & Welfare
Aiding gut health with a natural growth promotor
A study with Nile tilapia conducted in commercial production cages in Brazil showed the potential – in the absence of major disease threats – of a commercial, natural growth promotor that modulates the microbiota (inhibiting growth of pathogenic bacteria and promoting growth of beneficial bacteria) and inhibits quorum sensing.


