Norway holds position of dominance in French and German markets
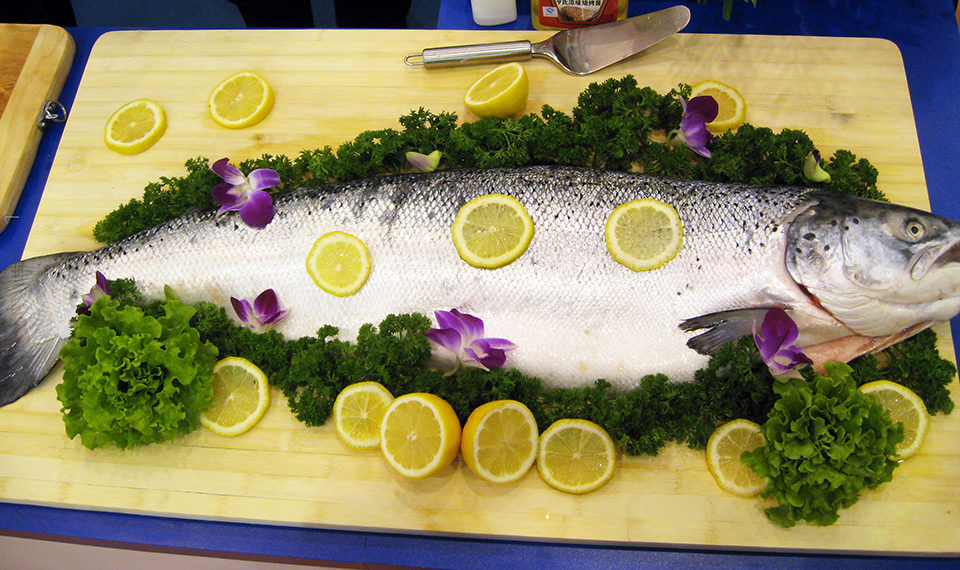
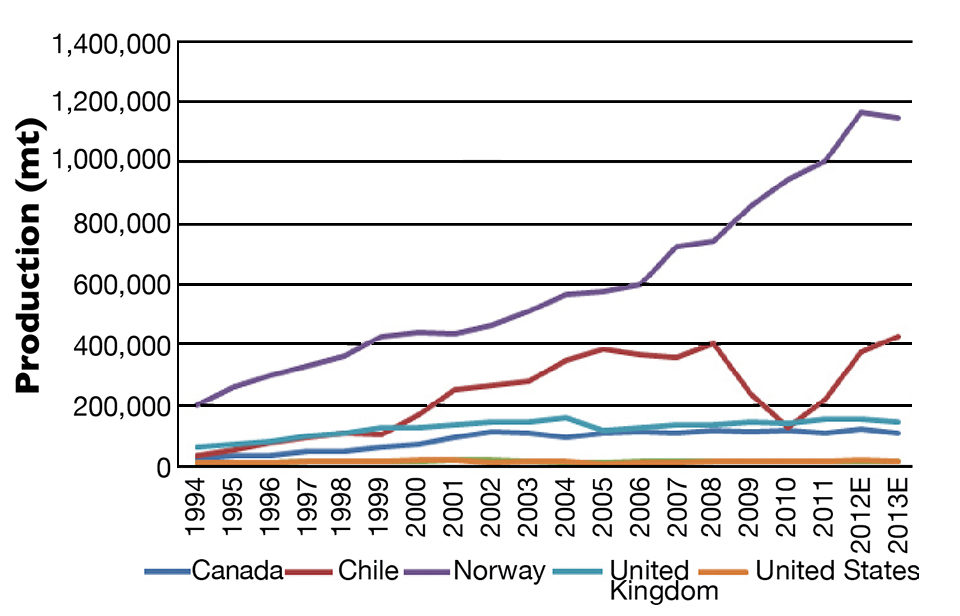
The supply of Atlantic salmon increased dramatically over the past two decades, with Norwegian producers driving much of the growth. While other salmon-exporting countries made minor expansions over the past two decades, Norwegian salmon production increased almost 600 percent. Chile was the only country with a similar rate of increase until infectious salmon anemia hit the sector. Although Chilean salmon is making a rebound, Norway continues to be the dominating producer in salmon production.
Fig. 1 shows the production of Atlantic salmon over the past two decades. It reflects the slow expansion in the United States, Canada and United Kingdom during the second half of the period. It also shows the rise, fall and rebound of Chilean salmon, and the increasing dominance of Norwegian salmon production in recent years.
Global, regional positions
It is evident that Norwegian salmon is the market leader in the global market, followed by Chilean salmon. The European market, however, mainly demands Norwegian, British and Irish farmed salmon, with limited penetration of frozen Chilean salmon.
To what extent are global positions in the salmon market reflected in individual markets in Europe, and to what degree does the demand for fresh salmon products from the market leader Norway face significant price substitution effects from competing salmon supplier countries?
French market
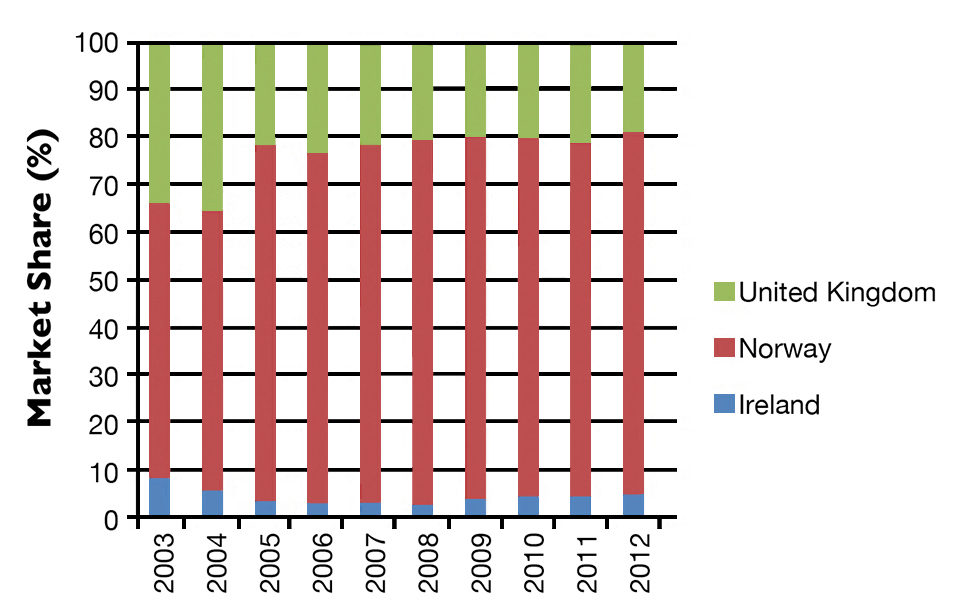
In France, the market for fresh whole salmon products (Fig. 2) is divided among fish from the U.K., Norway and Ireland. Although there were some changes in market shares in the past decade, major shifts among the three exporting countries were unnoticeable in recent years. Norwegian fresh whole salmon products maintained their leading market share, while British and Irish salmon kept their constant market shares after 2005.
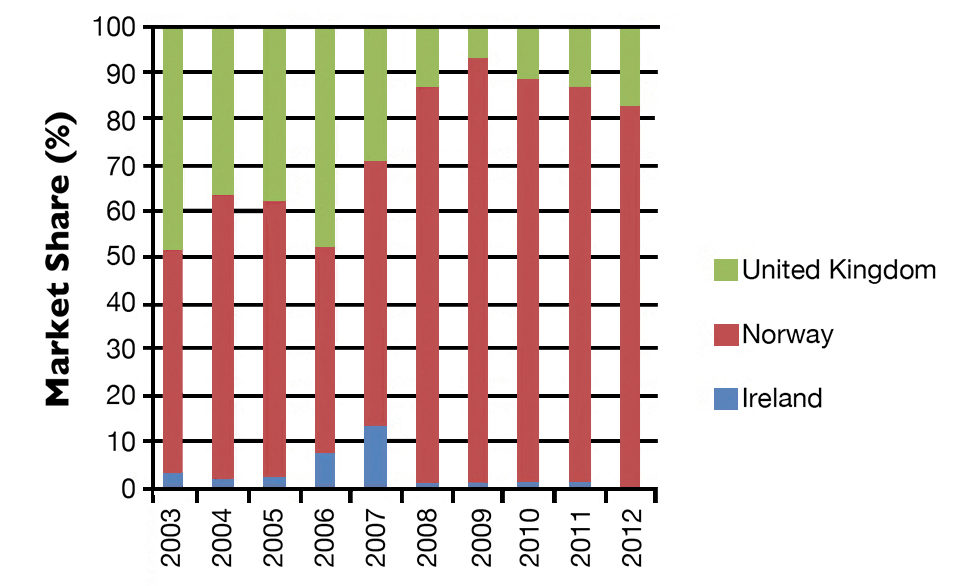
Unlike the market for fresh whole salmon, where U.K. exports play a significant role, the French market for fresh salmon fillets was dominated by Norwegian imports, with their 90 percent market share since 2003. Norwegian production started to surpass British volume after 2000 and almost eliminated imports from Ireland in the last decade.
German market
Although Norwegian salmon led in Germany’s imports of whole and fillet salmon, they were more dominant in the fresh whole section. As for fresh salmon fillets, imports from the U.K. made their way into the German market after 2000 but declined after 2006 (Fig. 3).
United Kingdom market
In the British market for fresh whole salmon and fresh fillets, Norwegian and Irish salmon compete against each other as well as the domestic production. Although Norwegian salmon play a significant if not dominant role here, their dominance is less consistent than in the French and German markets.
Ireland plays a much bigger role in the U.K. market than in the French and German markets. Aside from the fact that U.K. has its own salmon production, and hence Norwegian salmon is at a disadvantage, another explanation can be the distance between U.K. and Ireland. Since Ireland and U.K. are much closer to each other, lower transportation cost and superiority in freshness can contribute to demand.
An interesting development in the U.K. market for fresh salmon filleted products occurred from 2011 to 2012 (Fig. 4). The market was taken over by Irish salmon products for the first time, but lost again in the next year. Price played a major factor.
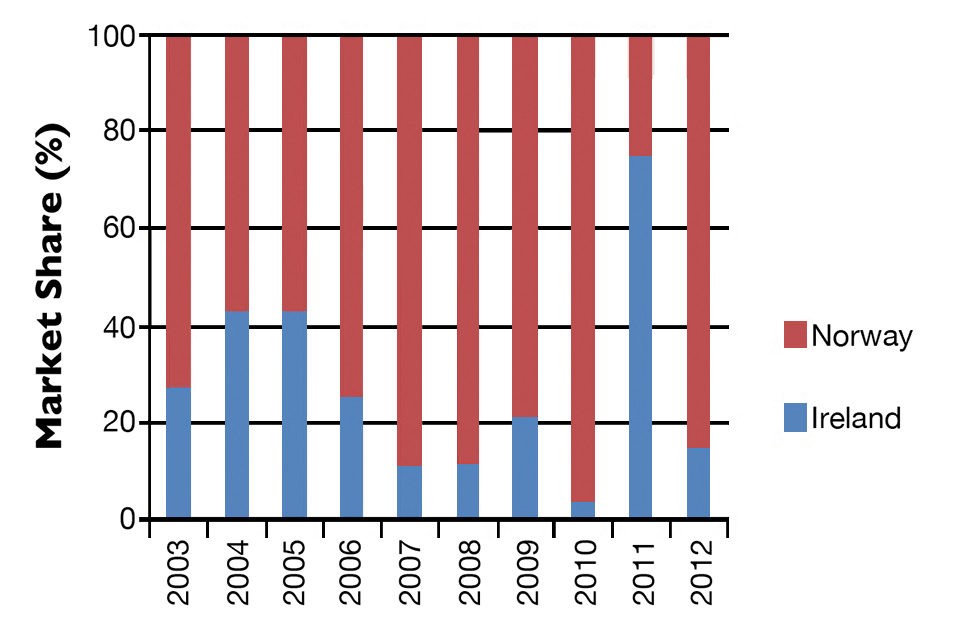
There was a price increase from €6.56 to €9.26 ($8.50 to $12.00) for Norwegian salmon from 2010 to 2011, where Irish salmon cost only €3.93 ($5.09) in 2011. However, Irish salmon filleted products rose to €12.59/kg ($16.32/kg) in 2012, when Norwegian salmon prices dropped to €4.92/kg ($6.37/kg). Although various factors contributed to the price shifts, the demand for salmon products in the U.K. market depends highly on prices.
Short-term elasticity
Short-term elasticities of demand for these importing markets can be estimated using econometric models. Separate models are estimated for fresh whole and fresh fillet salmon for the French, German and U.K. salmon markets.
French market
Table 1 shows the short-term elasticities of Norwegian fresh whole salmon in the French market. It indicates that an increase in Norwegian salmon price will result in a -0.88 decrease in demand. And while insignificant, Irish and British salmon are substitutes for Norwegian salmon, because the increase in Norwegian salmon price results in higher demand for the salmon from these two exporters. The expenditure elasticity is significantly positive at 0.967.
Liu, Short-term elasticity in French market,Table 1
| Variable | Coefficient | Standard Error | t | P > t |
|---|
Variable | Coefficient | Standard Error | t | P > t |
|---|---|---|---|---|
| Whole Salmon | ||||
| Import price, Irish (€/kg) | 0.090 | 0.059 | 1.530 | 0.128 |
| Import price, Norwegian (€/kg) | -0.875 | 0.084 | -10.440 | 0 |
| Import price, United Kingdom (€/kg) | 0.156 | 0.097 | 1.610 | 0.109 |
| Total import value | 0.967 | 0.064 | 15.080 | 0 |
| Salmon Fillets | ||||
| Import price, Irish (€/kg) | -0.036 | 0.044 | -0.820 | 0.414 |
| Import price, Norwegian (€/kg) | -0.869 | 0.149 | -5.830 | 0 |
| Import price, United Kingdom (€/kg) | -0.021 | 0.083 | -0.250 | 0.804 |
| Total import value | 1.096 | 0.236 | 4.630 | 0 |
When estimating the elasticities of Norwegian fresh filleted salmon in the French market (Table 1), an increase in Norwegian salmon price still results in a 0.870 decrease in Norwegian salmon demand. However, the cross-price elasticities for Irish and British salmon are highly insignificant, indicating limited substitution and competition with Norwegian salmon. The expenditure elasticity is significantly positive at 1.096.
German market
In the German market for fresh whole salmon (Table 2), an increase in the price of Norwegian salmon results in a decrease of 0.86 in demand. The British Atlantic salmon is a substitute for the Norwegian salmon, because an increase in the Norwegian salmon price results in a higher demand for the British import. The Irish cross-price elasticity is not significantly different from zero. The expenditure elasticity is significantly positive at 0.89.
Liu, Short-term elasticity in German market, Table 2
| Variable | Coefficient | Standard Error | t | P > t |
|---|
Variable | Coefficient | Standard Error | t | P > t |
|---|---|---|---|---|
| Whole Salmon | ||||
| Import price, Irish (€/kg) | 0.005 | 0.031 | 0.150 | 0.880 |
| Import price, Norwegian (€/kg) | -0.862 | 0.082 | -10.500 | 0 |
| Import price, United Kingdom (€/kg) | 0.231 | 0.058 | 3.990 | 0 |
| Total import value | 0.899 | 0.037 | 24.570 | 0 |
| Salmon Fillets | ||||
| Import price, Irish (€/kg) | 0.018 | 0.066 | 0.280 | 0.783 |
| Import price, Norwegian (€/kg) | -1.217 | 0.329 | -3.700 | 0 |
| Import price, United Kingdom (€/kg) | -0.034 | 0.123 | -0.280 | 0.780 |
| Total import value | 1.023 | 0.201 | 5.090 | 0 |
In Table 2, an increase in the price of Norwegian fresh filleted salmon leads to a relatively elastic decline of -1.21 in demand. The cross-price elasticities of Irish and U.K. salmon are highly insignificant, suggesting very limited substitution. Norwegian fresh filleted salmon in the German market has significantly positive expenditure elasticity at 1.02.
UK market
Since the main source of salmon in the U.K. market is naturally U.K, the competition for the import market is between Norway and Ireland. An increase in the import price of Norwegian fresh whole salmon caused a decline in its demand by 0.70 (Table 3). Irish salmon is a substitute, but the substitution effect is not statistically significant. The expenditure elasticity is significantly positive at 0.30.
Liu, Short-term elasticity in U.K. market, Table 3
| Variable | Coefficient | Standard Error | t | P > t |
|---|
Variable | Coefficient | Standard Error | t | P > t |
|---|---|---|---|---|
| Whole Salmon | ||||
| Import price, Irish (€/kg) | 0.047 | 0.111 | 0.420 | 0.674 |
| Import price, Norwegian (€/kg) | -0.701 | 0.185 | -3.780 | 0 |
| Total import value | 0.295 | 0.127 | 2.320 | 0.021 |
| Salmon Fillets | ||||
| Import price, Irish (€/kg) | 0.017 | 0.219 | 0.080 | 0.940 |
| Import price, Norwegian (€/kg) | -1.141 | 0.506 | -2.260 | 0.027 |
| Total import value | 0.137 | 0.487 | 0.280 | 0.780 |
Table 3 describes the short-term elasticities of Norwegian fresh filleted salmon products in the British market. Only the own price elasticity generated a significant result, where an increase in price generated a relatively elastic decline of -1.14 in the demand. The Irish salmon is not a significant substitute. As for the expenditure elasticity, it is positive but statistically insignificant.
Long-term elasticities
Long-term elasticities for salmon imports into the French, German, and British markets can also be estimated from the models. These estimates always have the same sign as the short-term elasticities, and the elasticity estimates are, as expected, similar in terms of statistical significance.
In summary, while an increase in Norwegian salmon prices always causes a decline in its demand, most of the cross-price elasticities are insignificant to classify salmon from the other sources as a substitute for the Norwegian salmon, with the exception of British fresh whole salmon in the German market.
Perspectives
The global position of Norwegian salmon is largely reflected in its market shares in the French and German fresh salmon import markets. Although there have been shifts, Norwegian fresh salmon remain dominant. In the U.K., the situation is a bit different, with the market having significant domestic production.
Overall, there is limited evidence of substitution between Norwegian fresh salmon and Irish and British product in terms of cross-price elasticities, both in the short and long run. To some extent, this probably reflects the inability of British and Irish salmon producers to respond to relative price changes with significant increases in supply, due to different restrictions on their production.
However, the intra-Norwegian competition among different Norwegian companies, as well as the competition with British and Irish salmon, means that prices for Norwegian fresh salmon products will not be allowed to rise to significantly higher levels in the long run.
(Editor’s Note: This article was originally published in the May/June 2013 print edition of the Global Aquaculture Advocate.)
Author
Tagged With
Related Posts

Intelligence
A land grab for salmon (and shrimp) in upstate New York
The operators of Hudson Valley Fish Farm see their inland locale as a pilot to prove that land-based fish farming, located in close proximity to major metropolitan markets, can be successful.

Intelligence
Consumer survey explores farmed, wild seafood perceptions
What do shoppers really think about farmed and wild seafood? Commissioned by The Fishin’ Co. and the Global Aquaculture Alliance, an extensive survey conducted earlier this year sought to determine the key drivers in consumers’ seafood purchasing habits and their perception of aquaculture.

Intelligence
Changes in European consumer perceptions of farmed salmon
Household surveys have been carried out annually since 2012 in France, Germany and the UK on perceptions and consumption patterns for salmon and meat from agriculture. Results show that salmon is generally perceived as having more beneficial effects than chicken on brain development, bone development, certain cancer risks and coronary heart disease risk.

Intelligence
Location matters most for newest Maine RAS venture
A leader at one of the new Maine RAS ventures talks ambitions for his group and the growing land-based aquaculture industry, with his home state at the epicenter of North American operations.


