Several techniques can measure water mixing

Mechanical aerators add dissolved oxygen to water, and depending upon the type, they also effect various degrees of water circulation. Mechanical water circulators, such as horizontal, axial-flow water circulators, low-speed paddlewheels and propellers, and air-lift pumps are designed to mix and circulate water, but provide limited aeration.
Some pond managers have installed mechanical water circulators to enhance water mixing beyond that provided by aerators. Those who feel that water circulation and mixing are equally as important as aeration in ponds seek to position aeration and circulation devices to achieve maximum water circulation.
Visible surface currents provide useful information for positioning this equipment. This technique cannot be quantified, however, and wind action can obscure surface turbulence from water currents. Thus, managers may seek other methods for evaluating water circulation and mixing.
Surface mixing
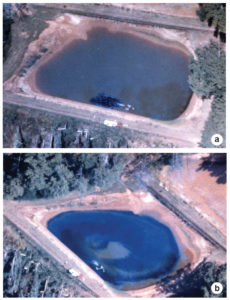
My first experience in measuring water circulation in ponds came 30 years ago, when Aeration Industries, Inc. asked me to find a way to make a visual depiction of water currents produced by one of its aerators for use in an advertising brochure. We poured a blue dye in front of the operating aerator while taking interval pictures of the pond surface from a light airplane.
Two graduate students took photos from the tightly circling plane, which had to land at the nearby airport after about 45 minutes. The tight turns had made the students and pilot quite ill, but they did capture excellent pictures (Figs. 1a and 1b).
The dye was completely distributed over the surface of the 0.4-ha pond in about 30 minutes. Of course, this method only revealed surface mixing, and it could not be repeated, for the dye persisted for months.
Overall mixing
The question then arose: How long would it take an aerator to completely mix the water in a pond of a given size? Several techniques can measure water mixing.
Salt method
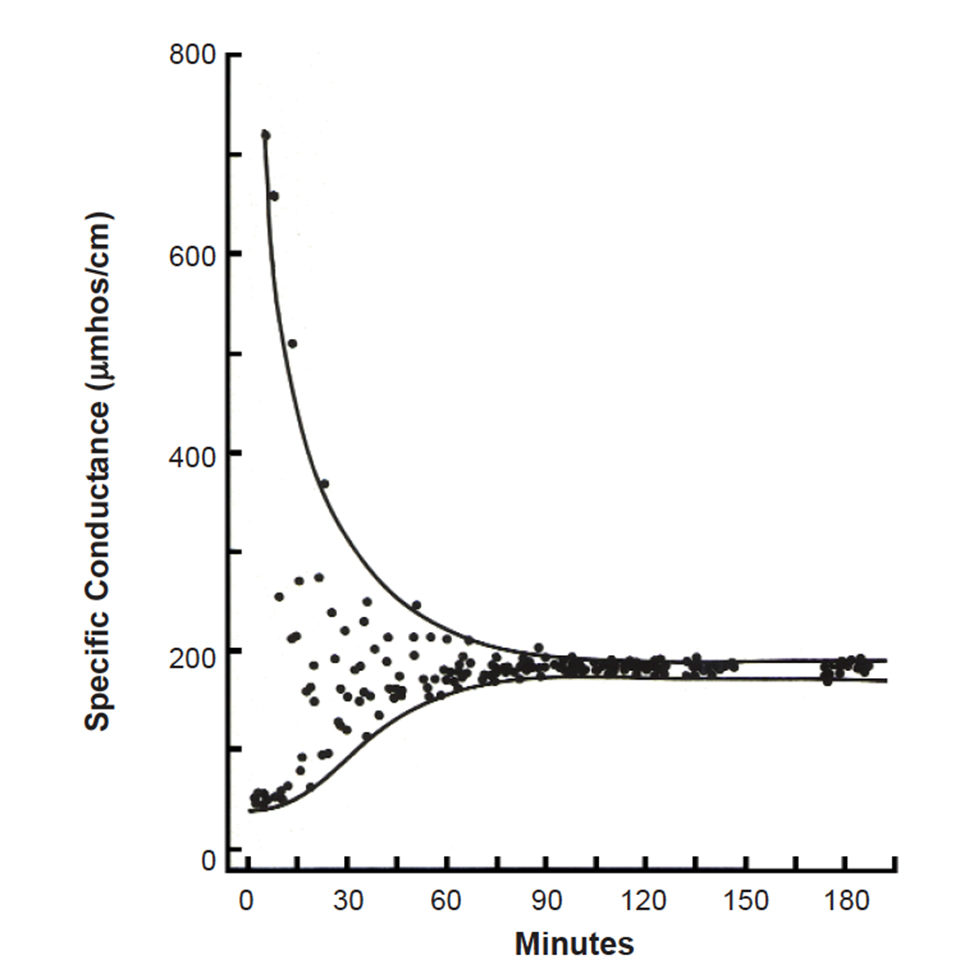
After the dye test, we dissolved 100 kg of sodium chloride in about 400 l of water and quickly poured the salt solution in front of an aerator mounted in a 0.4-ha pond of 1 meter average depth. A shift in water salinity of 25 milligrams per liter reflected the mixing effect.
Specific conductance was measured from a boat traveling over the pond surface along a grid identified with 12 stakes marked for either surface, mid-depth, or bottom measurements. It took about 10 minutes to complete the measurements for the entire grid. The process was continued until specific conductance measurements were essentially uniform within the pond after 70 minutes (Fig. 2).

The mixing rate (M.R.) was calculated as follows:

The mixing rate for the 2-hp aerator used in the study was 1,716 cubic meters per hp·hr.
Float methods

The salt method above can not be used in brackish water and is rather complex for “on-farm” use. One simpler method involves tossing floats in front of the aerator and noting their movement. Although wind affects the direction taken by light, wooden floats or empty plastic bottles, oranges make ideal floats, for they are relatively dense and sink into water enough to prevent wind drift, but not enough to make them difficult to observe.
Oceanographers often use drogues to follow ocean currents. Their current detection depth can be regulated beneath the float, which allows observation of speed and direction. Although these devices can be used in ponds, they tend to become tangled when several are released simultaneously in front of an aerator.
Gypsum block method
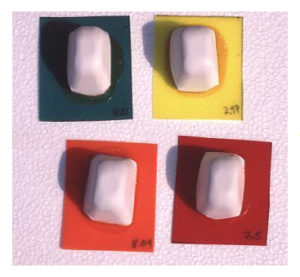
Oceanographers also have used the rate of dissolution of small gypsum (plaster of Paris) blocks to measure the relative velocity of water currents in coral reefs. The blocks can easily be made by pouring plaster of Paris into plastic ice cube trays and letting it harden. The individual blocks can then be cemented with waterproof glue to small sheets of plastic.
In testing, the blocks are weighed and mounted by thumbtacks at prescribed depths on wooden stakes positioned where current measurements are desired. After a few hours or days, depending upon water velocity, the blocks are removed, dried in an oven at 60 degrees-C, and reweighed.
The weight loss increases in direct proportion to increasing water velocity. By placing gypsum blocks in a pond, it is possible to determine where water currents are fastest and slowest. For best results, it is suggested that one block be suspended in an open submerged container of 100- to 200-liter volume. The weight loss from this block can be subtracted from the weight losses of the other blocks to adjust for dissolution in completely still water.
The gypsum block method provides excellent results in ponds with aerators or water circulators. Moreover, the blocks can be attached at different lengths along a horizontal bar attached to a slowly revolving vertical shaft. By calculating the speed at which the blocks at different positions travel through the water, the weight losses of the blocks convert to water velocity in meters per minute.
Current meters
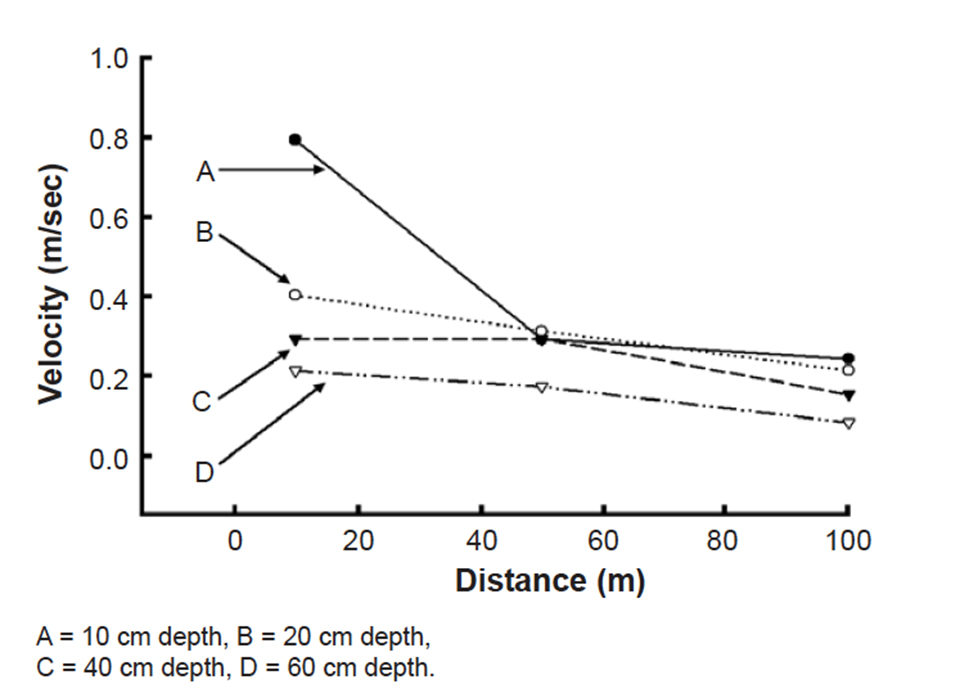
Finally, mechanically induced water currents in ponds can be evaluated with the aid of water current meters. The meters can be operated from a boat held stationary at different distances from an aerator. Water currents, and especially the surface current, decrease rapidly with distance from aerators (Fig. 3). At distances beyond 80 m, the flow usually is below the detection range of inexpensive current meters.

(Editor’s Note: This article was originally published in the September/October 2006 print edition of the Global Aquaculture Advocate.)
Now that you've finished reading the article ...
… we hope you’ll consider supporting our mission to document the evolution of the global aquaculture industry and share our vast network of contributors’ expansive knowledge every week.
By becoming a Global Seafood Alliance member, you’re ensuring that all of the pre-competitive work we do through member benefits, resources and events can continue. Individual membership costs just $50 a year. GSA individual and corporate members receive complimentary access to a series of GOAL virtual events beginning in April. Join now.
Not a GSA member? Join us.
Author
-

Claude E. Boyd, Ph.D.
Department of Fisheries and Allied Aquacultures
Auburn University
Alabama 36849 USA
Tagged With
Related Posts

Responsibility
Airlifts combine pumping, water treatment in recirculation systems
Using the buoyancy of the entrained air bubbles to lift the water, airlifts are more energy-efficient and provide more aeration, carbon dioxide removal and foam fractionation for dissolved solids removal than centrifugal pump systems.

Responsibility
A look at various intensive shrimp farming systems in Asia
The impact of diseases led some Asian shrimp farming countries to develop biofloc and recirculation aquaculture system (RAS) production technologies. Treating incoming water for culture operations and wastewater treatment are biosecurity measures for disease prevention and control.

Health & Welfare
A study of Zoea-2 Syndrome in hatcheries in India, part 3
In this third and final part, authors present recommendations to help reduce the incidence of Zoea-2 Syndrome, which is not caused by any known infectious agents in P. vannamei hatcheries in India.

Responsibility
Advances in super-intensive, zero-exchange shrimp raceways
Research at the Texas AgriLife Research Mariculture Laboratory is investigating ways to improve the economic viability of super-intensive raceways for shrimp production.

