Review of various machine vision‐based methods relating fish size and mass
This article summarizes the development of nonintrusive methods for fish biomass estimation over the past three decades and presents their basic concepts and principles. The strengths and weaknesses of each method are analyzed and future research directions are also presented. Studies show that the applications of information technology such as advanced sensors and communication technologies have great significance to accelerate the development of new means and techniques for more effective biomass estimation. However, the accuracy and intelligence still need to be improved to meet intensive aquaculture requirements. Through close cooperation between fisheries experts and engineers, the precision and the level of intelligence for fish biomass estimation will be further improved based on the above methods.
In intensive fish farming, the reliable estimation of fish biomass is very important for aquaculture industries. Fish biomass is derived from the total number of fish counted in a specific area of water multiplied by the average weight of fish sampled, which can be used to predict daily intake demand to avoid underfeeding or overfeeding. Fish biomass data can help aquaculture industries ensure the optimum use of the capital invested in facilities and control water quality affected by overfeeding. Quantitative estimation of fish biomass is the basis of scientific fishery management and conservation strategies for sustainable fish production. Therefore, it is crucial for aquafarmers to be able to estimate fish biomass accurately.
https://www.aquaculturealliance.org/advocate/little-fish-in-a-big-pond-minnowtech-aims-to-give-fresh-vision-to-shrimp-inventory/
The most common biomass estimation procedures depend on that the average weight of fish in ponds or cages can be determined by periodic sampling, and the number of existing fish is usually calculated by the discrepancy between the number of fish initially stocked and countable dead fish. Therefore, fish biomass can be estimated by multiplying the average weight by this number. However, manual sampling can cause physical damage or great stress to fish, affecting its welfare and growth. In addition, manual sampling is also usually time-consuming, laborious and has an inherent inaccuracy of 15 to 25 percent, giving rise to an issue of how to obtain fish weight by noninvasive ways.
Furthermore, the number of individuals can be obtained under normal conditions, but the number of losses cannot be quantified in the case of extensive deaths, theft or predators. The daily feed intake recorded can be also converted to fish biomass using expected feed conversion ratio (FCR), which may not be accurate enough. Therefore, using noninvasive, rapid and economically feasible methods for fish biomass estimation is necessary to meet intensive fishery farming requirements.
With the development of new information technologies, aquaculture researchers and producers have explored various methods to quantify fish biomass in cages or ponds without manual intervention. The number and types of these methods including machine vision, acoustics, environmental DNA and resistivity counter have been developed rapidly over the past three decades. These methods as a fast, noninvasive, objective and repeatable alternative provide possibility for remotely monitoring fish biomass in aquaculture.
This article – adapted and summarized from the original publication (Daoliang L. et al. 2020. Nonintrusive methods for biomass estimation in aquaculture with emphasis on fish: a review. Reviews in Aquaculture (2020) 12, 1390–1411.) – summarizes the development of various noninvasive methods that have been used for mass measurement, counting or direct fish biomass estimation over the past three decades, including machine vision (discussed here in part 1), acoustics, environmental DNA and resistivity counter (covered in upcoming part 2), and their basic concepts and principles.
Machine vision‐based methods
The application of machine vision instead of human eyes for object recognition – as a noninvasive, objective and repeatable tool – has been widely employed in aquaculture for size measurement, mass estimation, species and stock identification, gender identification, quality assessment, size grading, behavior monitoring and counting. Fish mass and number are closely related to fish biomass. Therefore, machine vision provides an effective means for monitoring fish biomass remotely under different scenarios. According to light wavelength range, the study of machine vision for fish biomass estimation is mainly focused on different types of light sources including visible light and infrared light.
Machine vision based on visible light
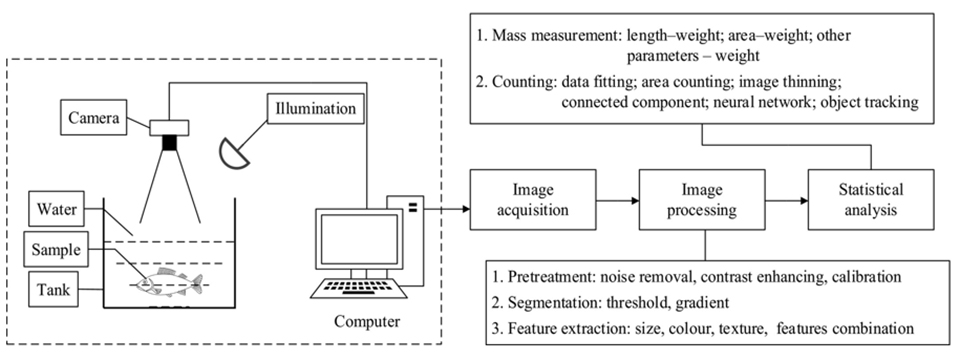
The monocular camera or stereovision system based on visible light offers image information at the pixel level, and then, quantitative information can be extracted and analyzed from digital images for object recognition, which has ability to improve the quality of human vision by electrically perceiving and understanding of an image. A typical machine vision system often consists of image acquisition, image processing and statistical analysis procedures, as shown in Fig. 1. As a noninvasive and cost-effective method, it has been widely used in aquaculture over the past two decades, and three of its major applications are fish mass measurement, counting and direct fish biomass estimation.
Fish mass measurement
Fish size (i.e. length, area, width and perimeter) is a vitally important parameter during different growth stages. Machine vision provides an automatic and effective approach for measuring size, which makes it possible to determine fish mass by size. Until now, weighting is the most common way to estimate fish mass, making it time-consuming, costly, laborious, invasive and resulting poor consistency. Therefore, automatic and noninvasive methods for mass measurement are of significant interest to the fish farming industry.
Fish length usually equals the length of the line that connects the head tip to the tail tip, which can be measured by linear or nonlinear methods in 2D or 3D. The relationships between fish length (L) and weight (W) have been extensively studied for many years and reported for many species of fish.
The relationship between fish area and weight has been reported in numerous studies. Generally, the fish area is computed directly by converting the number of its pixels to square centimeters, which can be used to approximatively predict fish weight. The area of fish image is usually uncertain due to the tail fins of fish, and some researchers have considered the effect of this factor on mass and proved that removals of tail fins did not improve accuracy. Some scientists have used machine vision to estimate the weight of some fish by lateral area without fins, showing that the model based on area did not perform well, but it is a relatively simple method. In contrast, the model based on area from fish side view without removal of tail fins performed well to predict the mass of other species. These and other studies show that using fish area can effectively predict its mass, but the accuracy still need to be improved to meet other fish species.
https://www.aquaculturealliance.org/advocate/one-fish-two-fish-fish-counting-tech-nets-funding-for-canadian-engineering-firm/
Some researchers have also attempted to assess other parameters, such as height, perimeter and other features. For example, scientists used a camera with special light to predict dead flatfish weight, but shadowy regions below objects reportedly caused volume errors. To address this issue, several 2D and 3D features extracted from 3D laser vision image were used to predict weight of other species.
Some studies have used stereo camera to predict the weight of Atlantic salmon based on multiple parameters extracted from images, while others used different fish shapes available from top and side views to predict fish weight. Other researchers developed statistical models based on external shape from fish lateral images to estimate weight of cultured sea bass; or adopted view area, length and height from fish lateral images without tail fins to estimate free-swimming jade perch mass. Reportedly, although using more feature variables can improve the accuracy of mass measurement, these models make less robust and prone to errors.
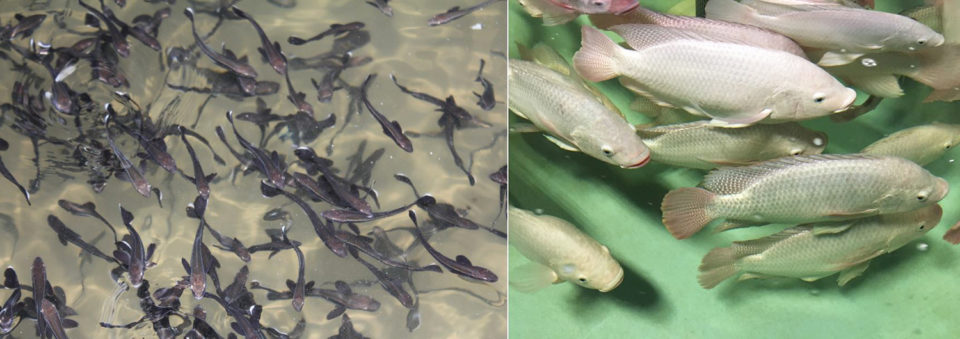
Many studies have shown that fish size is closely related to mass. However, the body of free-swimming fish might be not straight, which makes it inaccurate for length measurement. Therefore, it is necessary to develop bend models for free-swimming fish and a general model for mass estimation of each species, and the optimal model should be individually developed for each species.
Fish counting
Fish number at various growth stages can be vitally important for aquafarmers, because it can support and enable the scientific and reasonable preparation of containers for density control and development of a marketing schedule. The general counting methods are hand counting for big fish and weighting counting for fry. These methods not only are usually time-consuming and laborious but also can cause the stress to fish. And monocular camera or stereovision system has been widely applied to count fishes using various developed algorithms.
Back propagation, or BP [widely used optimization algorithm for machine learning] has been proposed to count fish from images, but the technology still has some limitations. Several pertinent studies have shown that calculation operations are time-consuming due to extensive computations. In order to simplify complex counting process, the relationship between number of pixels and number of fish has been used to count fish fry with relatively simple background. And the area information of the blobs that mark fish position was used to count fish fry in mostly uniform size fish. Likewise, other researchers have used area information of the contours compared with median area to count fish, but water level had to remain shallow to avoid overlap.
Other researchers have recently adopted a curve evolution method to count turbot fish fry. Other mathematical models have been proposed to locate fish from underwater videos and to count them, but still lack accuracy. And researchers recently used area and perimeter properties to count ornamental fish, which is low-cost and easy to handle.
In addition, object tracking technology has received significant research attention. For multiple free-swimming fish counting, the trajectory tracking algorithm provides an efficient and reliable way to avoid repeated counting of individual fish in multiple frames. Some researchers have used machine vision systems to track and count fishes with filtering techniques in a controlled environment, and this method reportedly can operate under severe environmental changes and handle problems such as occlusions. Other researchers have used various algorithms to track and count fishes from underwater videos in unconstrained environments, in their natural habitat, and even with trawl-based underwater camera systems to track multiple fish.
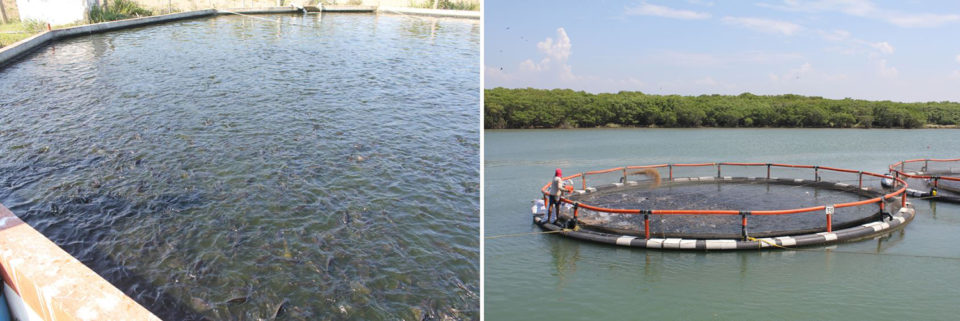
Machine vision technology provides a noninvasive, repeatable and objective tool for free-swimming fish counting, but it also has some disadvantages. For instance, a single camera is not adequate to capture the entire area for fish number. Therefore, multiple camera systems are required to integrate images at different positions to provide comprehensive perspective using image synthesis. In addition, there are still some challenges such as fish overlap, poor light, turbidity, bubbles and other factors, making it difficult for foreground segmentation. Appropriate tuning images and new algorithms for crowed counting could be used to resolve this issue. Due to low frame rate, entrance/exit of the view field of fish is frequent, making traditional multitarget tracking algorithm infeasible. Therefore, it is necessary to use a high frame rate camera to improve the accuracy.
Direct fish biomass estimation
Direct fish biomass estimation means that fish biomass weight can be obtained directly by fish biomass volume multiplied by fish biomass density, and the fish biomass volume can be obtained directly by laser scanning system. With the rapid development of machine vision system, the combination of laser systems with visual methods has been widely used for object inspection. Since the mid-1990s, the laser-scanning technology known as light detection and ranging (LiDAR) has developed rapidly in aquaculture, which can quickly obtain scanning object surface model. The laser-scanning technique makes automatic and intensive sampling of target surface possible in a short time. Several researchers have used this technology to perform indoor fish farming biomass estimation in real time with approximate 5 to 17 percent relative error.
The laser-scanning technology has proven to be a noninvasive and promising tool for estimating total fish biomass almost in real time. Although the limitations that laser scanner with automatic image analysis has are homogeneity of illumination and the presence of unwanted noise such as bubbles, the laser-scanner system is convenient and feasible to allow operations to be repeated periodically and frequently for discarding bad images for biomass estimation. However, fish biomass estimation depends on the values of density and volume. An approximate real biomass density value and the developments of specific image analysis software are necessary to improve the accuracy. In addition, the laser-scanner system is a large, heavy machine. Therefore, there is need to integrate inertial measurement device to simplify the platform implemented in intensive aquaculture for fish biomass estimation.
Machine vision based on infrared light
Infrared light is nonvisible light with a wavelength between 760 nanometers (nm) and 1 millimeter (mm). With advances in computer technology, machine vision based on infrared light has developed rapidly, which has been used to count fish in aquaculture. It provides a noninvasive means for counting fish and analyzing behavior, which is relatively simple and plays an important role in the development of effective method for fish biomass estimation. Machine vision based on infrared light includes fish counter and near-infrared (NIR) camera for fish biomass estimation.
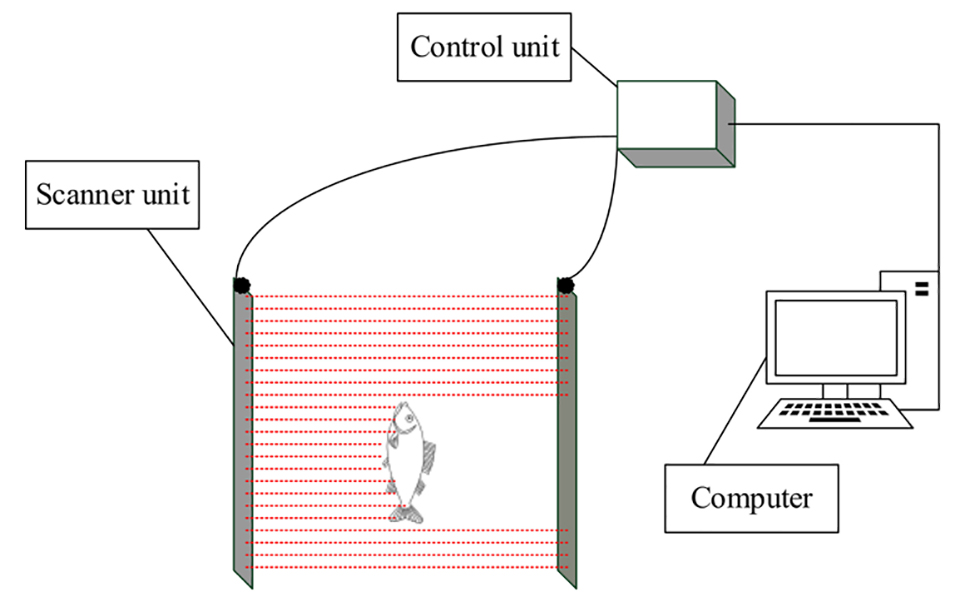
The fish counter consists of a scanner unit, control unit and computer (Fig. 2). The infrared beam net in scanner unit is generated between two scanning plates inside frame where a series of infrared light diodes are positioned to send infrared light beams to receivers on other side. The fish are forced to swim through the scanner unit, breaking a finely spaced lattice of infrared beams and generating shadow silhouette. However, the infrared light attenuates more rapidly in waters than in the air, especially in the turbid waters, which prevents physically infrared light from penetrating waters to reach scanner units. Due to this and other limitations, the technology needs further development to increase its accuracy.
Near‐infrared (NIR) cameras have been used for monitoring fish feeding behavior in tanks or cages. It has been used to track fishes in three-dimensional environment. The principle is based on the absorption of near-infrared light in water resulting different brightness. Counts of analyzed fish from images can be generally provided as a byproduct. Compared with stereovision systems, the near-infrared camera system requires no calibration, providing information in real time even if there is relatively dim light. It can be used to identify position in 3D space, but its capacity to track fishes under conditions of high illumination levels or longer distances needs to be improved.
https://www.aquaculturealliance.org/advocate/nonintrusive-methods-for-fish-biomass-estimation-in-aquaculture-part-2/
Now that you've finished reading the article ...
… we hope you’ll consider supporting our mission to document the evolution of the global aquaculture industry and share our vast network of contributors’ expansive knowledge every week.
By becoming a Global Seafood Alliance member, you’re ensuring that all of the pre-competitive work we do through member benefits, resources and events can continue. Individual membership costs just $50 a year. GSA individual and corporate members receive complimentary access to a series of GOAL virtual events beginning in April. Join now.
Not a GSA member? Join us.
Authors
-
Dr. Daoliang Li
Corresponding author
College of Information and Electrical Engineering
China Agricultural University
Beijing, China -
Dr. Yinfeng Hao
College of Information and Electrical Engineering
China Agricultural University
Beijing, China -
Dr. Yanqing Duan
University of Bedfordshire Business School
Luton, UK
Related Posts

Intelligence
10 takeaways from GOAL 2019 in Chennai, India
The Global Aquaculture Alliance held its GOAL conference in Chennai, India, and recruited a host of experts in various fields to share their expertise.

Innovation & Investment
iQShrimp: Cloud-based, predictive software for shrimp farmers
Cargill’s iQShrimp is a novel, cloud-based, digital platform that can capture and record relevant data from shrimp ponds through various automated systems to help shrimp farmers manage risk and make better management decisions.

Innovation & Investment
Little fish in a big pond: Minnowtech aims to give fresh vision to shrimp inventory
Because shrimp farmers lack accurate in-pond inventory, startup Minnowtech is on the verge of offering a data-driven solution. It’s got something to do with jellyfish.

Innovation & Investment
If it’s broken, fix it: Startup takes on shrimp industry in India
A serial tech entrepreneur and a shrimp trader want to be Amazon for India’s shrimp farming industry. An accelerator program half a world away has brought them closer to their goals.


