From physics to farming: An evaluation of an operational hydrodynamic and behavioral monitoring system
Editor’s note: The original article has a total of 10 authors, but we only include the contact information of the first and corresponding author. For a full list of authors, refer to the original publication.
Norway is the world’s leading producer of Atlantic salmon (Salmo salar) and the Norwegian government has decided that aquaculture production shall continue to grow, provided that it can be done in an environmentally sustainable way.
This is being implemented through the division of the Norwegian coast into 13 production zones, and in each an environmental indicator shall be used to determine if the effect is low, moderate or high. In these cases, the farming industry is allowed to grow (green), freeze production (yellow) or must reduce production (red). The system is therefore nicknamed the “traffic light system.” The only indicator used to measure sustainability is at present the effect of salmon lice (Lepeophtheirus salmonis), released from salmonid farms, on the mortality of wild salmonid fish.
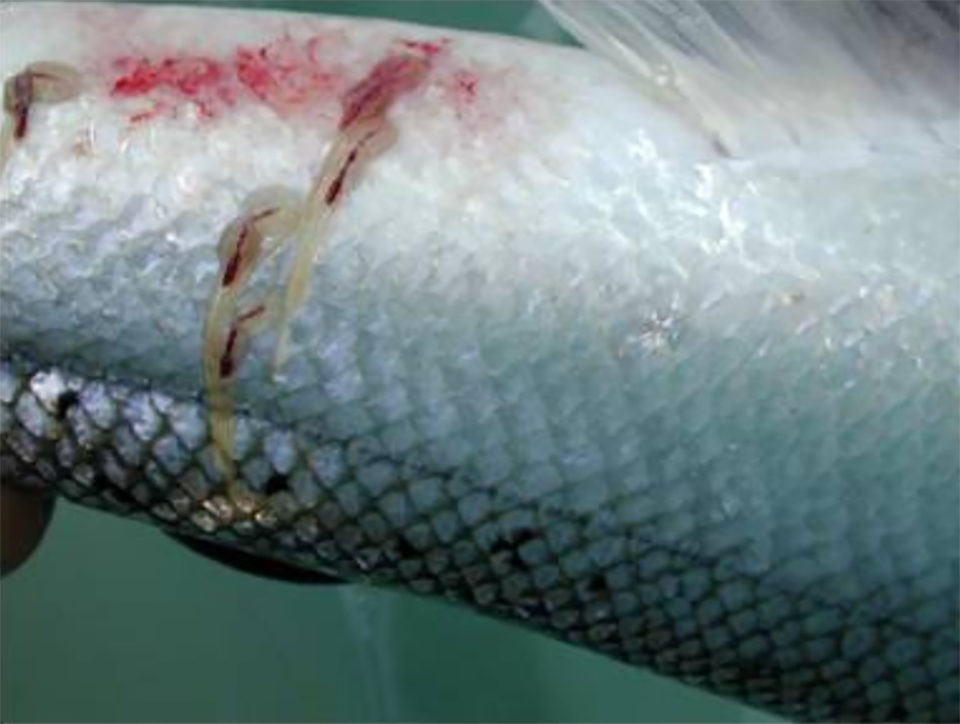
This parasite causes multi-million dollar losses annually to the farmed salmon industry, and continuous monitoring is needed to identify areas where the salmon lice densities will pose an unacceptable high risk of mortality for wild salmonid fish. Several models describing the infection pressure from farms based on both hydrodynamic models and statistical models have been developed.
Over the last ~15 years models based on hydrodynamic circulation has been implemented as a tool to predict the drift of the planktonic stages of salmon lice with water currents. These models have shown that the water currents may transport the lice tens of kilometers from the source farm. In addition to the calculated transport distances, the models have revealed lice densities with great spatial patchiness.
Here, we present a mechanistic approach which includes both hydrodynamics and lice behavior. This kind of operational salmon lice model system facilitates a comprehensive approach including dynamical modeling of the lice infestation pressure, considering all environmental variables (circulation, temperature, salinity, wind) with local variations along the fjord axis, regional variations between neighboring fjords and national variations along the entire Norwegian coast.
This article – adapted and summarized from the original publication – describes the operational salmon lice model, and further assesses the quality of the monitoring system, which are necessary for giving an accurate and robust assessment of the lice infestation pressure. We refer to the national operational monitoring system to both include the operational salmon lice model and the wild fish data, where the operational salmon lice model is a combination of a hydrodynamical ocean model and a salmon lice particle tracking model.
Study setup
The study covers the entire Norwegian coastline, which is more than 100,000 km long including fjords, islands and bays and 25,000 km without the islands. A study area this large requires intensive effort and sophisticated monitoring tools, as morphology (coastline and bathymetry) is irregular and complex.
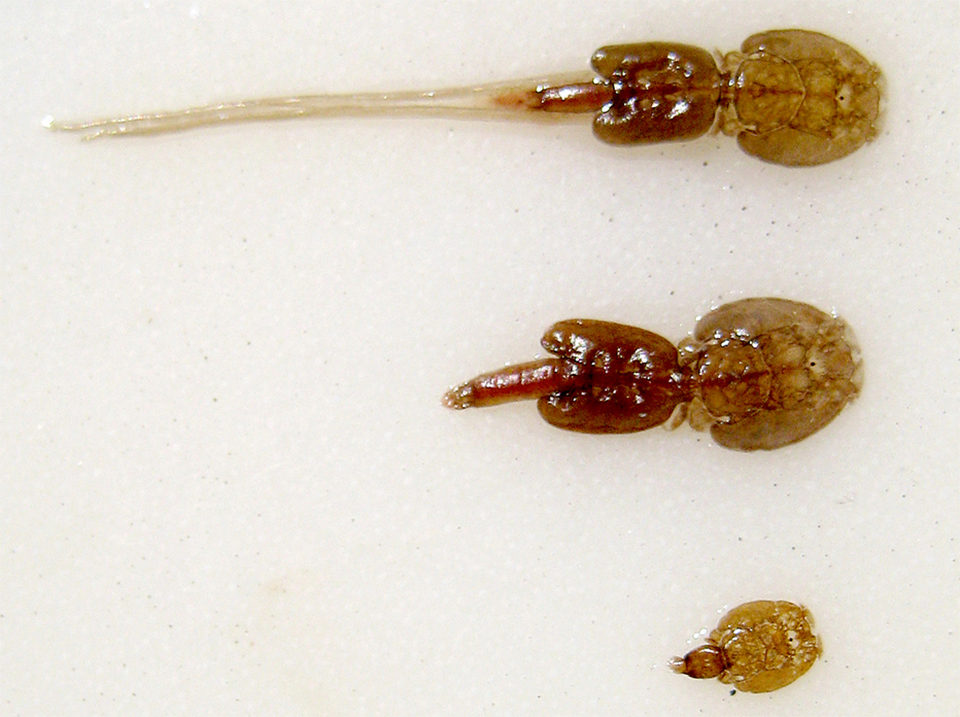
The Norwegian Meteorological Institute – responsible for operational ocean monitoring and forecasting of the Norwegian waters – has an operational suite of hydrodynamic ocean models that utilize Regional Ocean Modeling Systems models. One of these models is the NorKyst800, which is the innermost model covering the Norwegian coast with 800-meter horizontal resolution. Based on results from NorKyst800, the Institute of Marine Research runs the salmon lice model and publishes the results online every week, showing total number of copepodids (the free-swimming larval stage of lice) added over the previous 10 days.
For detailed information on this study, including background information; study area; the hydrodynamic ocean model; hydrographic observations; the salmon lice particle tracking model; the release of salmon lice from fish farms; observed infestation pressure on wild-caught trout; the operational monitoring system; and the evaluation of the modeled infestation pressure, please refer to the original publication.
Major findings
For the first time, we can present a hydrodynamic ocean model system that covers the entire Norwegian coastline, and where the quality of the modeled infestation pressure is tested against observations on wild-caught trout and char. By using two complementary data sources – the operational model and wild fish data – we can provide an improved system for assessment of risk and sustainability, which is the foundation for knowledge-based advice to management authorities.
The national monitoring program for salmon lice on wild salmonids in Norway aims at describing the infestation pressure on wild fish in all areas with intensive salmonid farming. This is a substantial task, indicating the need for an adaptive surveillance based on predictions of areas with high lice infestations on wild fish, which may be verified by subsampling of wild salmonids. Implementation of an operational salmon lice model makes it possible to monitor the infestation pressure along the entire Norwegian coast in near real-time. In our study we demonstrated that a fully mechanistic approach covering the entire Norwegian coast is feasible both technically and qualitatively. The maintenance of a fully operational model is technically challenging and has been made possible through the cooperation between IMR and MET Norway.
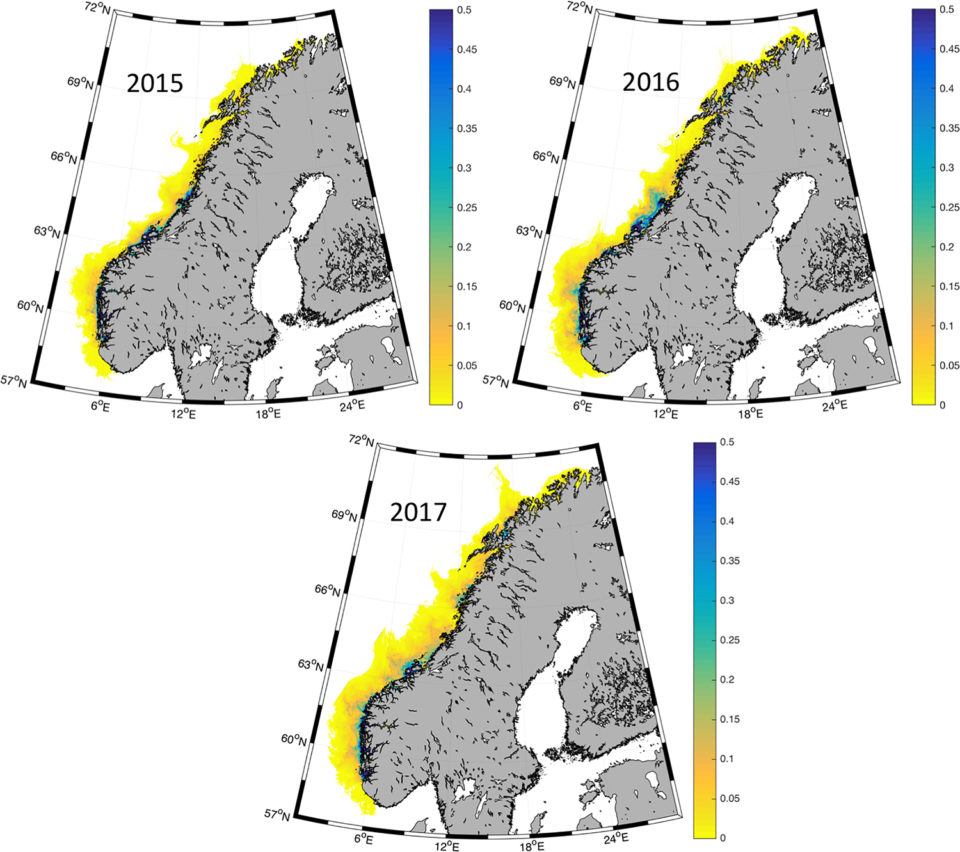
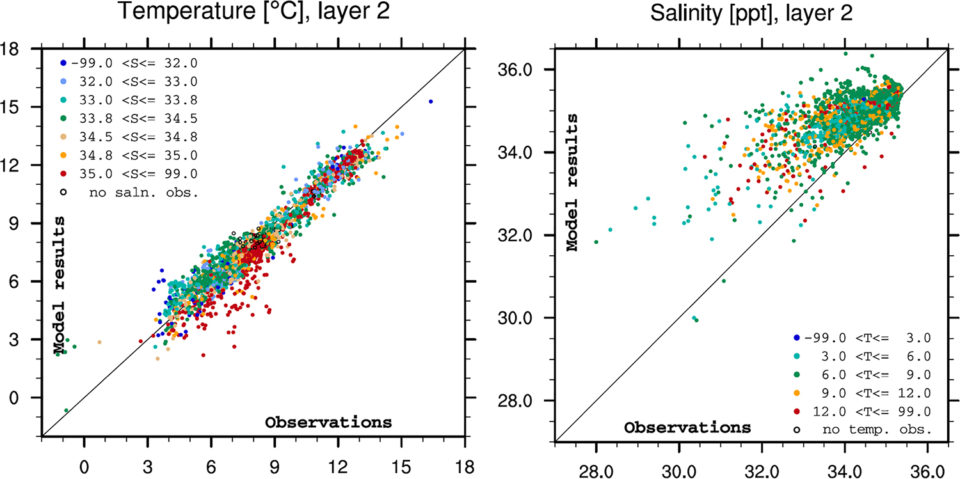
The operational salmon lice model – including both the hydrodynamic ocean model and the salmon lice particle tracking model – has been running for several years and has proven to be reliable in the production of salmon lice infestation pressure in near real-time all along the Norwegian coast. With regard to quality, this paper has showed good comparisons between model and observations for both hydrographic properties (Fig. 2) and salmon lice dispersion (Fig. 3). Previously the salmon lice model has been validated against sentinel cages in the Hardangerfjord area, while here we have shown that the model is valid along the entire coast.
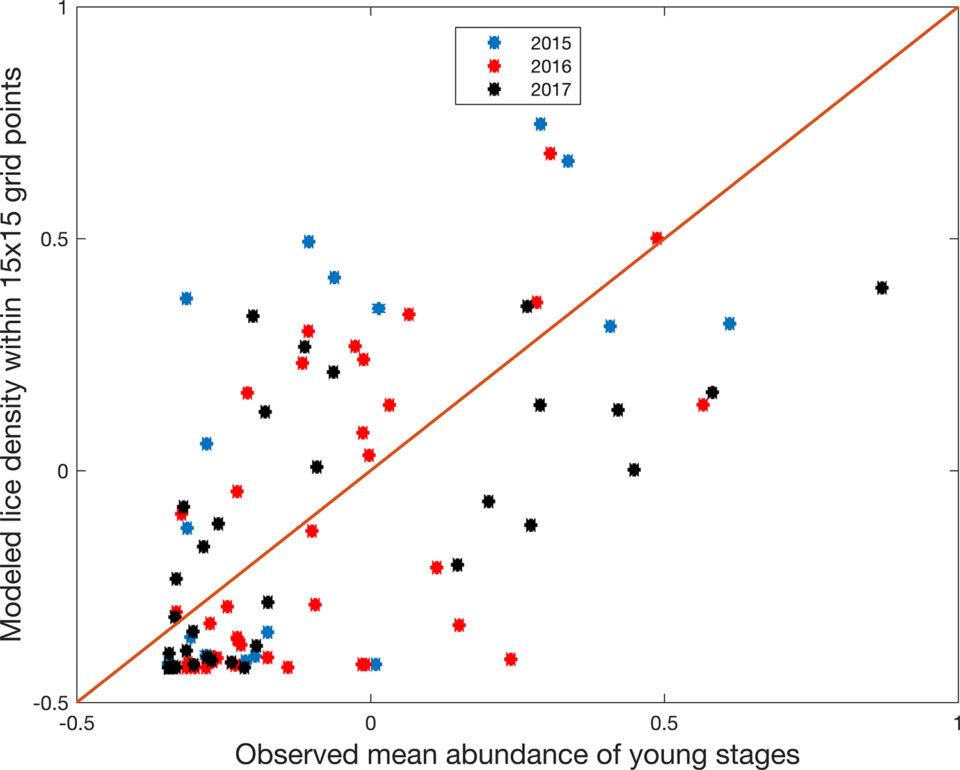
Updated infestation pressure all along the coast is invaluable information for evaluation of the carrying capacity of wild fish with respect to salmon lice, and is therefore an important measure for the management of the salmon industry towards sustainable growth. This model system will be – in combination with other model systems like field observations – included in the knowledge base which is needed for implementation of the new “traffic light” management system.
Since the model is able to predict areas of high infestation pressure, and by extensive use of an adaptive monitoring where areas with high infestation pressure is verified using subsampling, the locations where wild fish are captured are not randomly selected. This will affect the overall assessment for an area if the observations of salmon lice on wild fish are interpreted by themselves. In addition, field monitoring is time consuming and expensive, especially in a country like Norway where the coast is long, complex and many locations are remote. Therefore, in order to evaluate the infestation pressure in the 13 production areas, observations and model results must be considered complementary and should always be used together.
In our study we showed that the quality of the model results is good at the monitoring stations, and that the model is well suited for evaluation of the infestation pressure also between the monitoring stations. By combining these two data sources, it is possible to assess the overall infestation pressure in a production zone. Field monitoring will continue, and comparisons are done continuously to make sure that the quality is maintained also in the future.

Value for management
Implementation of a national operational monitoring system makes it possible for the first time to assess the infestation pressure from salmon lice along the entire Norwegian coast in near real-time. This allows for a quick identification of high-risk areas where salmon and trout will be especially vulnerable for salmon lice infections. It is important to identify salmon lice “hot spots” within the production zones and document with observations the salmon lice intensity in these areas. It is also of crucial importance to be able to monitor the extent of a high-risk area within the production zone and the time evolution of this fraction.
Altogether, this makes it possible for the government to initiate necessary measures to mitigate the high infestation pressure when it becomes a problem for wild salmonid fish. According to the salmon lice risk index that estimates increased mortality due to salmon lice infections developed by other researchers, all infections above 0.3 lice per gram are assumed to cause 100 percent mortality. If the total lice-induced mortality within a production zone exceeds 30 percent on a population level, the salmon production has to be reduced as a part of the “traffic light system.”
Perspectives
Results of our study proves the quality of a modeled infestation pressure on wild fish, far away from the source, namely, fish farms. It is, therefore, reasonable to assume that the model resolves the most important transport mechanisms of salmon lice, specifically ocean circulation and lice behavior. This is important since the Norwegian government has decided that salmon lice induced mortality on salmon smolt during migration from rivers to the open ocean will be the index for controlling sustainable growth. The model system we have described here is well suited for providing the infestation pressure that can be used for calculating the number of lice on salmon smolt migrating through a fjord system.
The operational model system is also suitable for developing a lice mitigation strategy for fish farmers. The system can determine how the treatment, including different timing, at the various farms in a production zone affects the regional infestation pressure. Next, it is possible to test various model scenarios where different positioning and size of farms can be evaluated, in addition to increase and decrease in production.
Now that you've finished reading the article ...
… we hope you’ll consider supporting our mission to document the evolution of the global aquaculture industry and share our vast network of contributors’ expansive knowledge every week.
By becoming a Global Seafood Alliance member, you’re ensuring that all of the pre-competitive work we do through member benefits, resources and events can continue. Individual membership costs just $50 a year. GSA individual and corporate members receive complimentary access to a series of GOAL virtual events beginning in April. Join now.
Not a GSA member? Join us.
Author
Tagged With
Related Posts

Health & Welfare
Animal health giants have sea lice in their crosshairs
Alltech and Benchmark have been working on the next generation of sea lice solutions and believe they have new products that can help salmon farmers win.

Health & Welfare
In sea lice fight, salmon farmers phasing out hydrogen peroxide
An over-reliance on medical and chemical controls, along with warming waters, led to a surge in sea lice. With such treatments waning in effectiveness, operators turn to other, safer measures.

Health & Welfare
Chem-free fixes emerging in sea lice saga
Salmon farmers, using emerging technologies, are exploring new methods of sea lice mitigation in an effort to overcome one of the industry’s most persistent problems. New chemical-free innovations show an industry eager to adapt and adopt environmentally safe practices.

Innovation & Investment
Thinking outside the cage: Avant-garde aquaculture in Norway
Salmon farming in Norway is poised for an innovation boom. The biggest players are putting cutting technology in the water to solve some of the industry’s most persistent problems, such as sea lice, fish escape and waste management.


