Production costs decline at greater scale


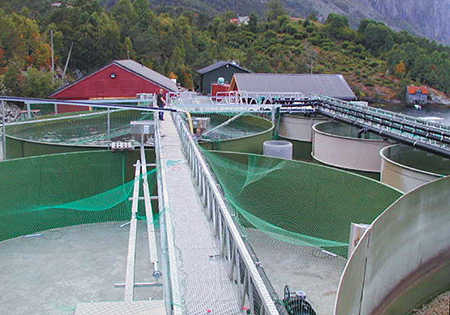
Over the last 20 years, the productivity of trout and salmon fry and smolt hatcheries and farms has increased significantly. In Norway, these land-based farms are located along the coast and discharge effluent water directly to the sea. Most farms are single flow-through systems, but a growing number practice partial or “tank-internal” recirculation of water.
In addition to the generally improved quality of feed and fish strains, the introduction of efficient systems for energy utilization and aeration has played an important role in farm intensification. The development of effective vaccines and photoperiod treatments has also contributed significantly to this enhanced productivity.
Production trends
Data on major production-efficiency parameters at Norwegian hatcheries and smolt farms are presented in Table 1. Annual production at Norwegian hatcheries and smolt farms increased about fivefold since 1985. The average farm production was 934,000 smolts and 310,600 fry in 2000, up from about 360,000 smolts and 190,000 fry in 1990. The biomass produced increased even more, as the present average size of smolts at delivery is 80 to 120 grams, compared to 30 to 50 grams some 15 years ago.
Bergheim, Productivity in Norwegian smolt farms, Table 1
| Parameter | 1985/90 | 2000 |
|---|
Parameter | 1985/90 | 2000 |
|---|---|---|
| Production: | ||
| 1,000 smolts/farm/year | 100-300 | 500-2,000 |
| Tons/farm/year | 3-15 | 40-250 |
| 1,000 smolts/man-year | Over 150 | 300 |
| Feed-conversion ratio | 1.8-2.5 | 0.9-1.2 |
| Water consumption (l/kg/min) | 0.5-2.5 | 0.1-0.5 |
| m3/kg produced | 1,000-1,700 | 100-200 |
Table 1. Productivity in Norwegian smolt farms, 1985/90-2000 (includes fry and smolts).
Shorter cycles

Shorter production cycles are a striking trend of the past few years. There are two distinct annual biomass peaks in modern farms: in springtime and late summer or early autumn. The 8- to 10-month-old fish delivered between August and October, characterized as “0-year-old smolts,” comprise a significant portion of the smolts produced today. The so-called “1-year-old smolts” transferred to seawater cages in spring are actually 15 to 18 months from hatching.
Improved productivity
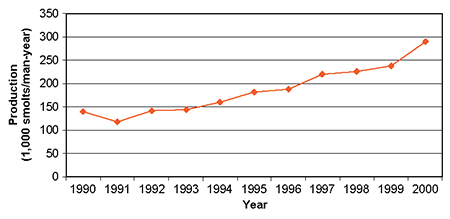
Intensification efforts have led to improved productivity (Fig. 1). An average of about 300,000 smolts and fry are now produced each man-year.
Water consumption

Since the mid-1980s, authorities have required a minimum flow supply of 1.5 cubic meters per 100,000 smolts produced annually. Without oxygenation of the water, flow rates fluctuated 0.5 to 2.5 liters per kilogram per minute throughout the year (Table 1). The addition of pure oxygen then significantly reduced the flow requirements, which are now typically in the 0.3 to 0.5 liters per kilogram range.
According to a new regulation for hatchery licensing, the lowest allowable flow in single flow-through systems is 0.3 liters per kilogram. However, lower water supply is permitted in systems that remove toxic gases (CO2, NH3).
Mainly due to the use of oxygenation technology, water consumption at most smolt farms is at now 100 to 200 cubic meters per kilogram fish produced, compared to 1,000 to 1,700 cubic meters per kilogram 15 years ago.
Shortages
Before delivery of smolts in spring and late summer, hatcheries often experience water shortages. These deficits are a frequent problem in summer, with temperatures over 16 degrees C and reduced river flow. Topical solutions are partial water recycling and stripping of carbon dioxide. Accumulation of carbon dioxide is a potential problem in most intensive farms because of the predominant soft water of Norwegian coastal watercourses.
Production costs
Corresponding to the improved productivity, production costs for smolts steadily decreased since 1990 (Fig. 2). During the 1991-94 period, costs were reduced by nearly 50 percent. These reduced costs have been of vital importance to the smolt industry. In the early 1990s, selling prices in several regions were lower than production costs. The average cost allocations for 2000 are shown in Table 2.
Bergheim, Average production cost allocation, Table 2
| Feature | Total Cost (%) |
|---|
Feature | Total Cost (%) |
|---|---|
| Roe and fry | 17 |
| Feed | 13 |
| Vaccination | 11 |
| Electricity | 4 |
| Insurance | 2 |
| Salary | 19 |
| Other operating costs | 22 |
| Fixed costs (depreciation and financial) | 12 |
Conclusion
The Norwegian smolt industry now produces 150 to 200 million smolts annually, with production likely to increase. Recently published prospects indicate a need for 40 percent more smolts in the next five years. As the number of running hatcheries per smolt farms varied 250 to 270 over the last 10 years, most of the increased production will be met by further intensification of production at existing farms.
(Editor’s Note: This article was originally published in the June 2002 print edition of the Global Aquaculture Advocate.)
Now that you've finished reading the article ...
… we hope you’ll consider supporting our mission to document the evolution of the global aquaculture industry and share our vast network of contributors’ expansive knowledge every week.
By becoming a Global Seafood Alliance member, you’re ensuring that all of the pre-competitive work we do through member benefits, resources and events can continue. Individual membership costs just $50 a year. GSA individual and corporate members receive complimentary access to a series of GOAL virtual events beginning in April. Join now.
Not a GSA member? Join us.
Author
-
Dr. Asbjorn Bergheim
Senior Researcher
Rogaland Research
N-4068 Stavanger, Norway
Tagged With
Related Posts

Health & Welfare
A look at tilapia aquaculture in Ghana
Aquaculture in Ghana has overcome its historic fits and starts and is helping to narrow the gap between domestic seafood production and consumption. Production is based on Nile tilapia.

Intelligence
10 takeaways from GOAL 2019 in Chennai, India
The Global Aquaculture Alliance held its GOAL conference in Chennai, India, and recruited a host of experts in various fields to share their expertise.

Health & Welfare
A study of Zoea-2 Syndrome in hatcheries in India, part 1
Indian shrimp hatcheries have experienced larval mortality in the zoea-2 stage, with molt deterioration and resulting in heavy mortality. Authors investigated the problem holistically.

Health & Welfare
Advances in tilapia nutrition, part 1
This two-part review brings together scientific and field advances in tilapia nutrition and feeding to better support the formulation of feeds for better production performance.


