Nutrient requirements, roles of functional feed additives need exploration

Traditional feed formulations for marine fish are high in marine ingredients, containing 40 to 45 percent fishmeal and 10 to 15 percent fish oil. There is ecological and ethical opposition to the use of these finite aquatic resources as an ingredient for feeding cultured fish species, as well as growing economic concern about their future availability and cost due to increasing demand from the expanding global aquafeed industry.
In contrast to fishmeal and fish oil, soybean meal and soybean oil are abundant sources of feed protein and fat, with current global production estimated at more than 153 million metric tons (MT) and 36 million MT, respectively. Increased replacement of fishmeal and fish oil by soybean products offers possibilities to stabilize formulation costs for marine fish feeds.
However, many farmers of marine fish are hesitant to use high levels of soybean products in feed due to fears of reduced palatability and digestibility, slower growth and poorer feed conversion compared to traditional feeds containing high levels of marine ingredients. Consumer fears of reduced health benefits from fishmeal and fish oil replacement could be allayed by a finishing period prior to slaughter, during which the fish are fed feeds containing high levels of the marine products to restore their content of omega-3 highly unsaturated fatty acids.
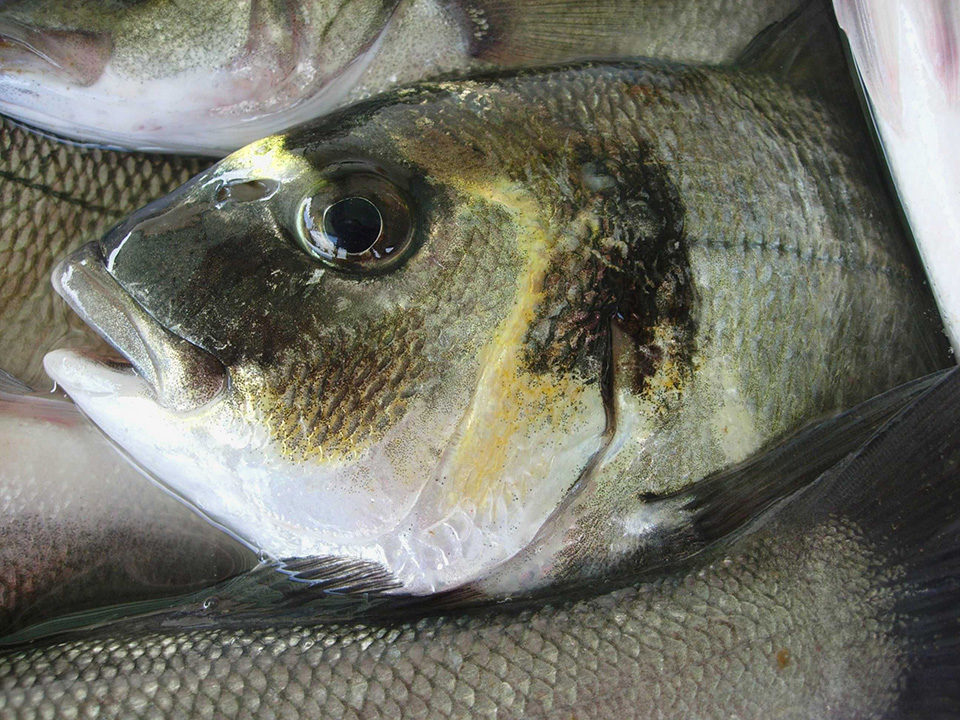
Previous work by the main author showed that gilthead sea bream (Sparus aurata) fed a diet in which fishmeal and fish oil provided only 35 percent of the dietary protein and 60 percent of the fat had growth, feed conversion, fillet/liver composition and gut histology equivalent to fish that received a control feed with levels of fishmeal and fish oil that provided 65 and 95 percent of dietary protein and fat, respectively. The study also evaluated replacement of protein and fat of marine origin down to 15 percent of dietary protein and 55 percent of dietary fat using plant ingredients and nutritional compensations.
Test feed formulations
In more recent work by the authors, three diets with 45 percent crude protein and 20 percent crude fat were formulated for testing with gilthead sea bream (Table 1). With the FM65 reference feed, 65 percent of dietary protein was provided by fishmeal, and 95 percent of dietary fat came from fishmeal and fish oil.
Robles, Formulations of test feeds, Table 1
| FM65 | FM15A | FM15B |
|---|
FM65 | FM15A | FM15B | |
|---|---|---|---|
| Prime fishmeal (67% C.P.) | 42.50% | 9.80% | 9.80% |
| Fish oil | 15.70% | 10.80% | 10.50% |
| Soybean meal (50% C.P.) | 18.30% | 30.00% | 30.00% |
| Soy protein concentrate (65% C.P.) | – | 15.40% | 11.90% |
| Soya oil | – | 6.00% | 6.00% |
| Soybean lecithin | – | 1.00% | 1.00% |
| Wheat gluten (78% C.P.) | 3.10% | 6.10% | – |
| Corn gluten (60% C.P.) | 4.00% | 10.00% | 6.30% |
| Pea protein (78% C.P.) | – | – | 11.60% |
| Wheat flour | 15.90% | 7.90% | 8.10% |
| Vitamin/mineral premix | 0.50% | 0.50% | 0.50% |
| Monocalcium phosphate | – | 0.80% | 1.63% |
| L-lysine (78%) | – | 0.45% | 0.53% |
| D.L.-methionine (99%) | – | 0.20% | 0.37% |
| Threonine (98%) | – | – | 0.24% |
| Palatability enhancer | – | 1.00% | 1.00% |
| Digestibility enhancer | – | – | 0.50% |
In the FM15A and FM15B test diets, fishmeal and fish oil were replaced by vegetable sources of protein and fat, predominantly soy products due to their cost efficiency compared to other plant ingredients. For these feeds, 15 percent of dietary protein came from fishmeal and 55 percent of the dietary fat came from fishmeal and fish oil.
FM15A was formulated using a mix of soybean meal and soy protein concentrate to provide 55 percent of dietary protein in combination with traditional vegetable protein concentrates. Palatability enhancers corrected for reduced feed intake, and essential amino acids, available phosphorous and phospholipids were added.
In the FM15B treatment, the same levels of fishmeal and fish oil were applied as in FM15A, but the formulation was additionally compensated by further improving the essential amino acid balance, increasing the available phosphorous level and stimulating lipid digestibility with a digestive aid.

Feeding trial
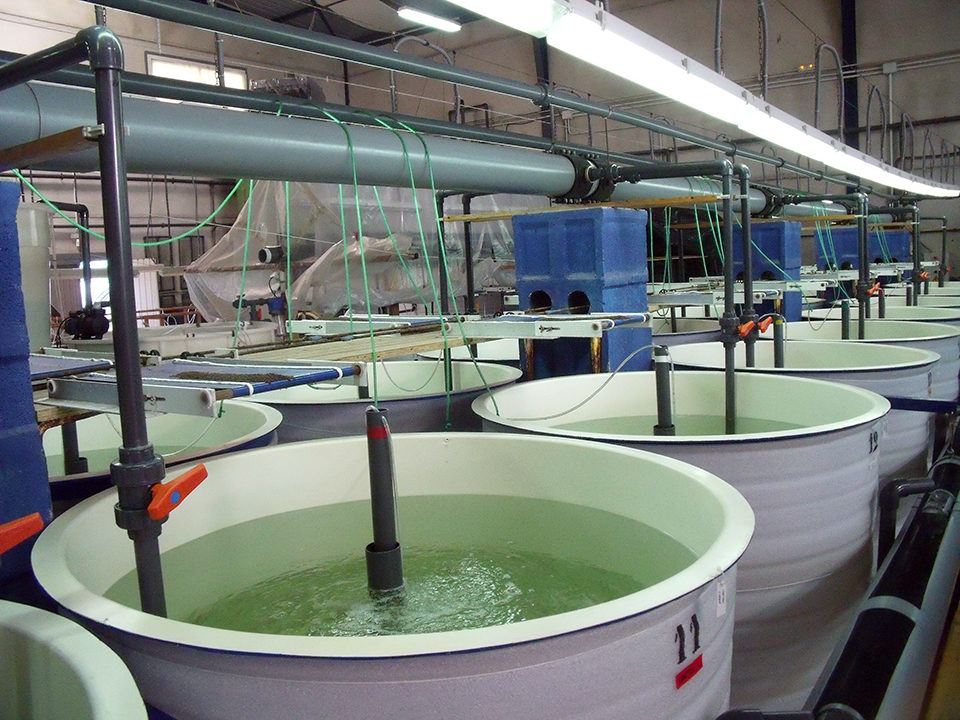
The experiment was carried out in a recirculating aquaculture system with 18 tanks of 300-L capacity. Gilthead sea bream fingerlings of 5.5-gram initial weight were reared over 11 weeks, with well seawater at 23 ± 1 degrees-C and salinity of 36 ± 1 ppt. The system had a biofiltration unit, sand filter and protein skimmer. Water renewal was 10-15 percent/day, depending on water quality conditions. Fish were stocked at 50 individuals/tank and acclimatized to the system for two weeks. Photoperiod was set at 12 hours of light/day.
The fish received the experimental diets for nine weeks from automatic belt feeders placed on top of each tank. Feed rations were calculated on a percentage of body weight for all the treatments. Uneaten pellets were collected at the outlet of each tank. Temperature and dissolved oxygen levels were measured daily, while other standard water quality parameters were measured three times weekly.
Results
No significant (P < 0.05) difference was found between the FM65 and FM15B diet treatments in terms of specific growth rates and feed-conversion rates (Table 2). Diet FM15A resulted in significantly lower values for these parameters.
Robles, Performance of seabream, Table 2
| FM65 | FM15A | FM15B |
|---|
FM65 | FM15A | FM15B | |
|---|---|---|---|
| Specific growth rate (%/day) | 2.55 ± 0.08a | 2.16 ± 0.04b | 2.47 ± 0.07a |
| Feed-conversion ratio | 1.04 ± 0.06a | 1.24 ± 0.03b | 1.05 ± 0.03a |
| Hepatosomatic index (%) | 1.24 ± 0.07 | 1.29 ± 0.05 | 1.16 ± 0.14 |
| Viscerosomatic index (%) | 5.57 ± 0.61 | 5.93 ± 0.05 | 5.44 ± 0.24 |
| Fillet index (%) | 19.02 ± 0.49 | 19.19 ± 0.13 | 18.96 ± 0.48 |
| Dry matter fillet* | 29.53 ± 0.25 | 29.53 ± 0.38 | 29.23 ± 0.25 |
| Crude protein fillet* | 19.57 ± 0.35 | 19.37 ± 0.21 | 19.73 ± 0.55 |
| Crude fat fillet* | 10.73 ± 2.87 | 8.50 ± 0.30 | 8.13 ± 0.40 |
* Data expressed as percentage wet weight.
No statistically significant difference was found among the three diets for hepatosomatic index, viscerosomatic index or fillet index. The fat level of the fillets was the lowest in the FM15B group. Concerning histological analyses of the intestinal epithelium, no differences were found among diets, and no pathological effects were noticed in any of the samples.
Gilthead sea bream fed practical feeds in which fishmeal and fish oil provided only 15 percent of dietary protein and 55 percent of dietary fat with 52 percent soybean products providing 55 percent of dietary protein showed deterioration of growth and feed conversion, despite nutritional compensation using crystalline amino acids, phospholipids, feed phosphate and palatability enhancers.
However, additional formulative corrections to the FM15A diet resulted in fish performance similar to that of seabream fed the FM65 control diet. The corrections included improving the essential amino acid balance using crystalline amino acids and pea protein concentrate, supplementation of available phosphorous and the addition of an herbal-based digestive aid.
Current ingredient prices do not yet justify the extreme levels of fishmeal replacement evaluated in this study. Nevertheless, the work shows that the formulation of sustainable and cost-effective feeds using reduced levels of marine ingredients depends on further improving our knowledge of nutrient requirements and the roles of functional feed additives.
(Editor’s Note: This article was originally published in the July/August 2009 print edition of the Global Aquaculture Advocate.)
Now that you've finished reading the article ...
… we hope you’ll consider supporting our mission to document the evolution of the global aquaculture industry and share our vast network of contributors’ expansive knowledge every week.
By becoming a Global Seafood Alliance member, you’re ensuring that all of the pre-competitive work we do through member benefits, resources and events can continue. Individual membership costs just $50 a year. GSA individual and corporate members receive complimentary access to a series of GOAL virtual events beginning in April. Join now.
Not a GSA member? Join us.
Authors
-
Rocio Robles
Caditec Testing S.L.
Pol. El Trocadero
C/Holanda 29, 11510 Puerto Real
Cádiz, Spain -
Sam Ceulemans
INVE Nutri-Ad
INVE Technologies nv
Dendermonde, Belgium -
Peter Coutteau, Ph.D.
INVE Nutri-Ad
INVE Technologies nv
Dendermonde, Belgium -
Francesc Padros, Ph.D.
Fish Pathology Diagnosis Service
Universidad Autónoma de Barcelona
Barcelona, Spain -
Michael Cremer, Ph.D.
American Soybean Association
International Marketing
St. Louis, Missouri, USA
Tagged With
Related Posts

Health & Welfare
Algae alternatives serve in larval rearing of sea bream
Sea bream fry are produced using the greenwater technique in which microalgae are added to larval-rearing tanks during the first 20 to 30 days after hatching.

Aquafeeds
A look at phospholipids in aquafeeds
Phospholipids are the major constituents of cell membranes and are vital to the normal function of every cell and organ. The inclusion of phospholipids in aquafeeds ensures increased growth, better survival and stress resistance, and prevention of skeletal deformities of larval and juvenile stages of fish and shellfish species.

Health & Welfare
Botanical extracts improve productivity of shrimp, pangasius
In a study with pangasius, dietary administration of a blend of botanical extracts improved performance, reducing intensity of gill parasite infestation.

Health & Welfare
Computer modeling helps grow fish
For farmers, computer modeling helps analyze crop production and environmental effects. For managers, it assists with carrying capacity assessments and licensing issues.


