Search for reliable, accurate method continues

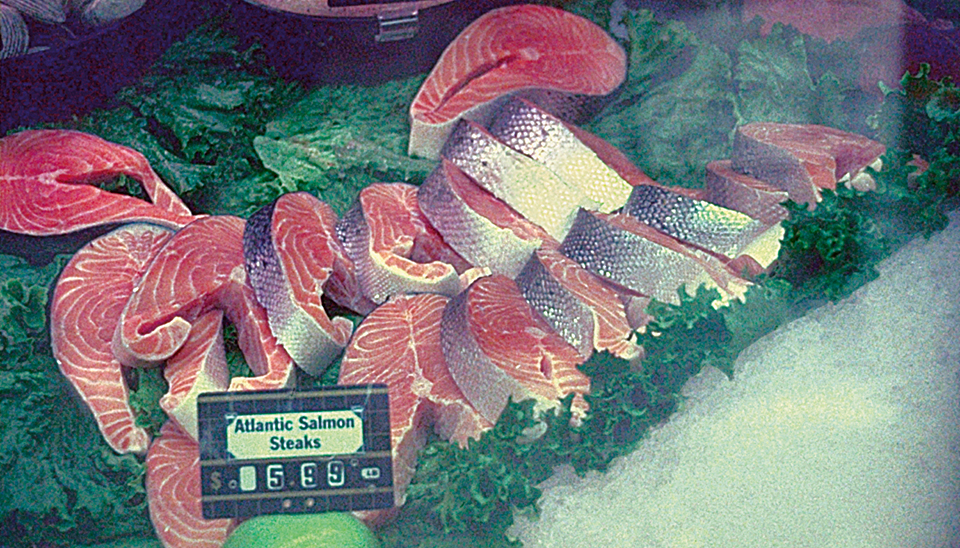
Quality deterioration in fish is somewhat unique in that high quality can be maintained for an extended period of time, but once spoilage begins, quality degrades at a rapid rate. Consequently, the time between the onset of spoilage and full spoilage may be only a few days, depending on the species, physiological state of the fish at harvest, and storage temperature.
Despite the importance of this topic and much research through the years, an accurate and reliable method to objectively measure or predict spoilage is not available yet.
Product deterioration
Deterioration can be microbiological or nonmicrobiological in nature. Upon fish death, microorganisms – or the enzymes they secrete – migrate into the flesh and cause changes in flavor and odor. Consequently, total or selective microbiological analyses have been proposed by some as a way to determine quality.
Nonmicrobiological deterioration can be further classified as either enzymatic or nonenzymatic. Enzymatic deterioration is caused by enzymes naturally present in fish flesh. The most significant of these affect flavor. The most prominent nonenzymatic deterioration is rancidity caused by the attack of oxygen on the chemically unsaturated fatty substances in fish muscle and other tissues.
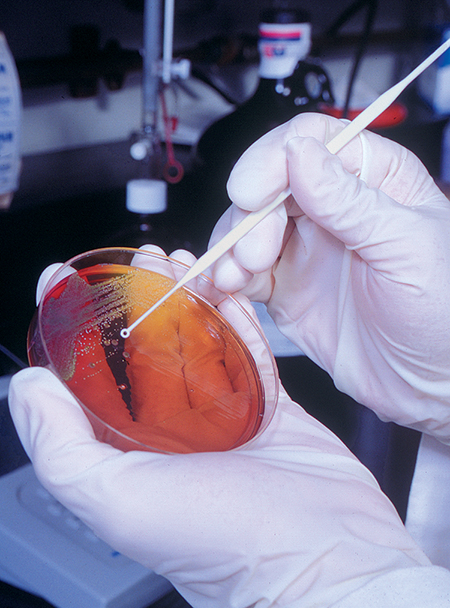
Microbiological tests
Published research results show a wide variation in microbiological data, even when fish are stored at or near identical temperatures (Table 1). Cod and bream stored at 0 degrees-C have similar microbial populations that increase similarly with storage time. The microbial population on sea bass exhibited only minor variation during 12 days of storage. Herring and mackerel had high initial populations that increased rapidly during storage.
Flick, Variation in microbiological data (total plate count, log CFU/g) for various fish species, Table 1
| Days Storage | Bream (Japan) 0° C | Cod (Japan) 0° C | Sea Bass 0° C | Mackerel (India) 0° C | Herring 0° C |
|---|
Days Storage | Bream (Japan) 0° C | Cod (Japan) 0° C | Sea Bass 0° C | Mackerel (India) 0° C | Herring 0° C |
|---|---|---|---|---|---|
| 0 | 1.1 | 1.3 | 4.5 | 4.1 | |
| 1 | 4.4 | ||||
| 2 | 1.2 | ||||
| 3 | 5.2 | ||||
| 4 | 1.1 | 1.3 | 5.2 | ||
| 5 | 4.9 | 6.1 | |||
| 6 | 1.1 | 1.8 | |||
| 7 | 4.8 | 6.9 | |||
| 8 | 1.1 | 2.2 | 7.7 | ||
| 9 | 7.1 | ||||
| 10 | 1.2 | 3.0 | 8.4 | ||
| 12 | 1.6 | 3.1 | 5.0 | ||
| 14 | 2.0 |
The information in Table 1 indicates no relationship between the microbial populations and quality. The reader is left to differentiate the differences between high, marginal, and unacceptable quality. The same scenario can be observed when fish are stored at other temperatures. Several differential microbiological tests have been proposed (Table 2), but none has emerged as a reliable quality index.
Flick, Microbiological tests proposed for microbiological evaluations, Table 2
| • Total aerobic plate count • Anaerobic plate count • Plate count with added salt • Mesophilic plate count • Psychrotrophic plate count • Hydrogen sulphide-producing bacteria plate count • Coliforms • Fecal coliforms • Escherichia coli • Specific bacteria identification analyses |
|---|
• Total aerobic plate count • Anaerobic plate count • Plate count with added salt • Mesophilic plate count • Psychrotrophic plate count • Hydrogen sulphide-producing bacteria plate count • Coliforms • Fecal coliforms • Escherichia coli • Specific bacteria identification analyses |
|---|
| No data available in table |
Chemical tests
Since microbiological analyses have not provided the desired degree of reliability, numerous chemical tests have been proposed for quality assessment of fish. While a review of each test is not possible here, it is useful to review some of the reports concerning them.
Total volatile bases
Table 3 contains information on one of these tests (total volatile bases) on fish stored in ice or at 10 degrees-C. Significant variation occurred between species and temperatures. As with the microbiological information, the relationship of the chemical results was not compared to quality.
Flick, Total volatile base (mg %) of various fish species, Table 3
| Days Storage | Bream (England) 0° C | Bream (England) 10° C | Mackerel (India) 0° C | Cod (Japan) 0° C | Sole (U.S.) 0° C | Mackerel 10° C |
|---|
Days Storage | Bream (England) 0° C | Bream (England) 10° C | Mackerel (India) 0° C | Cod (Japan) 0° C | Sole (U.S.) 0° C | Mackerel 10° C |
|---|---|---|---|---|---|---|
| 0 | 6 | 5 | 2 | 16.7 | ||
| 1 | ||||||
| 2 | 8 | 2 | 27.9 | |||
| 3 | 10 | 6 | ||||
| 4 | 7 | 2 | 66.9 | |||
| 5 | 6 | |||||
| 6 | 7 | 2 | 103.1 | |||
| 7 | 12 | 12 | 9 | |||
| 8 | 6 | 2 | ND | |||
| 9 | 13 | |||||
| 10 | 14 | 173 | 13 | 3 | ||
| 12 | 16 | 4 | ||||
| 14 | 204 | 19 |
For example, bream stored at 0 degrees-C had a concentration of total volatile bases of 14 mg percent after 10 days of storage, while the concentration in sole was only 3 mg percent. At 1 degrees-C, lactarius and lingcod had almost identical total volatile base concentrations (27.4 and 28 mg percent, respectively) after eight days of storage. A mackerel stored at 10 degrees-C had a total volatile base concentration of 103.1 mg percent after six days, while bream stored at the same temperature had a concentration of only 12 mg percent at 12 days.
The usefulness of the test is negated by the ability of such a small temperature variation to make a significant difference in concentration and the large variations observed in total volatile base concentration at identical temperatures.
Trimethylamine test
Another frequently reported test to determine quality is trimethylamine (Table 4). Again, the variation between species and the minimal variation between storage temperatures does not provide significant reliability for assessing quality. The concentration of trimethylamine in the muscle tissue of bream and Canadian cod after 14 days of 0 degrees C storage was 8 and 38 mg percent, respectively.
Flick, Concentrations of trimethylamine (mg %) in the muscle tissues, Table 4
| Days Storage | Bream (England) 0° C | Bream (England) 10° C | Cod (Canada) Iced | Cod (Canada) -5° C | Croaker (U.S.) 2° C | Flounder (U.S.) 2° C | Grouper (India) 0° C | Lactarius 1° C | Cod 0° C |
|---|
Days Storage | Bream (England) 0° C | Bream (England) 10° C | Cod (Canada) Iced | Cod (Canada) -5° C | Croaker (U.S.) 2° C | Flounder (U.S.) 2° C | Grouper (India) 0° C | Lactarius 1° C | Cod 0° C |
|---|---|---|---|---|---|---|---|---|---|
| 0 | 0.4 | 0.3 | 0.04 | 0.0 | 0 | ||||
| 1 | 0.6 | 1.5 | |||||||
| 2 | 0.05 | ND | 1 | ||||||
| 3 | 7 | 0.9 | 0.3 | ||||||
| 4 | 25 | 25.1 | 2.7 | 1 | |||||
| 5 | 40 | 29.2 | |||||||
| 6 | 12 | 0.6 | 0.06 | 4.2 | 0 | ||||
| 7 | 0 | 4 | |||||||
| 8 | 5.5 | 2 | |||||||
| 9 | 26 | ||||||||
| 10 | 0 | 34 | 0.08 | 5 | |||||
| 12 | 0.10 | 14 | |||||||
| 14 | 8 | 39 | 38 | 0.5 | 0.11 |
Perhaps more disturbing is the information reported on Canadian cod and cod, which exhibited a variation in trimethylamine exceeding 24 mg percent after 14 days of 0 degrees-C storage. Similar varied results have been observed with thiobarbituric acid, hypoxanthine and ammonia tests.
Test reliability

Perhaps the only positive statement concerning the objective analyses is that the tests appeared to be more reliable when one sample was examined at a constant temperature during a specific storage period. Unfortunately, this does not provide any help to individuals who wish to define the quality of a sample at some point between harvest and consumption, which is the major demand for quality assessment.
Histamine test kit
There has been some success with determining the concentration of histamine in scombroid and related fish. A marketed test kit provides rapid measurement of histamine concentrations in fish muscle. While the kit cannot provide information on the sensory attributes of the product, it does provide information on whether the product is safe for consumption. In addition, since the results are quantitative, a buyer can reject a fish or fish lot if the histamine concentration is judged to be too close to an established regulatory limit.
Rapid tests for microorganisms
The many rapid tests for microorganisms on the market are useful for safety, rather than quality. Rapid tests are available for determining the presence of Listeria spp. microorganisms, Staphylococcus aureus toxin and Salmonella. There is a zero-defect action level for Salmonella and Listeria monocytogenes in ready-to-eat fish and shellfish products.
Research continues
Studies continue to identify more rapid and reliable analytical methods for assessing fish quality. For example, correlation coefficients for chemoluminescence that assess rancidity in fish oils have been promising. Tests that determine changes in electrical properties – such as the conductivity and capacitance of skin-on fish – are being developed, although none have shown promise to date. Other tests have included the electronic nose, liquid chromatography, gene probes, monoclonal antibodies, polymerase chain reaction kits, gas chromatography, ion selective electrodes and various types of sensors.
Conclusion
Despite much research, systems to objectively measure and predict spoilage are not available yet. Although sensors that use advanced technologies are currently being developed for commercial use in determining fish quality, a good nose is still the most reliable index of assessing quality.
(Editor’s Note: This article was originally published in the October 2002 print edition of the Global Aquaculture Advocate.)
Now that you've finished reading the article ...
… we hope you’ll consider supporting our mission to document the evolution of the global aquaculture industry and share our vast network of contributors’ expansive knowledge every week.
By becoming a Global Seafood Alliance member, you’re ensuring that all of the pre-competitive work we do through member benefits, resources and events can continue. Individual membership costs just $50 a year. GSA individual and corporate members receive complimentary access to a series of GOAL virtual events beginning in April. Join now.
Not a GSA member? Join us.
Author
-

George J. Flick, Jr., Ph.D.
Food Science and Technology Department
Virginia Tech (0418)
Blacksburg, Virginia 24061 USA
Tagged With
Related Posts

Health & Welfare
Antibiotic-resistant bacteria, part 1
No antimicrobial agent has been developed specifically for aquaculture applications. However, some antibiotic products used to treat humans or land-based animals have been approved for use at aquaculture facilities.

Intelligence
Byproduct utilization for increased profitability, part 1
Protease enzymes are important industrial enzymes that have diverse applications in food, leather, silk and the agrichemical and pharmaceutical industries. Fish are considered one of the richest sources of proteolytic enzymes.

Intelligence
Fat content, freezing affect cold-smoked salmon quality
Product quality in cold-smoked salmon is best maintained by smoking fresh fish with high fat content and freezing them after, not before, smoking.

Intelligence
Pulsed light improves food safety, quality
Pulsed light appears to kill all types of bacteria and eukaryotic microorganisms with equal effectiveness and could be a cost-effective control method.

