Great variability in aquaculture production necessitates replicates of treatments, controls

Aquaculture producers can benefit from conducting trials to determine whether new products or management techniques will increase production, facilitate management and be cost effective. The cost aspect is particularly important, because no matter how effective a new product or procedure is in increasing production or simplifying management, farms usually should not adopt it unless it will provide equal or greater profitability. Trials also may be used to determine the most effective way of using a product or method.
Variability in aquaculture
The great variability in aquaculture production derives from chance, differences in production units, variability in seedstock because of origin or handling, weather conditions and numerous other factors. Because of this, new products or methods (treatments) and the practices in current use (controls) should be replicated. At least three replicates of each are needed, and five replications of each are better.
Determination of the most effective application rates for products such as fertilizers or amendments to improve water quality typically requires a minimum of six treatment concentrations. In such trials, the number of experimental units required can be reduced by using only one or two experimental units per concentration, and determining the optimum application rate from a dose-response curve prepared from the data collected in the trial.
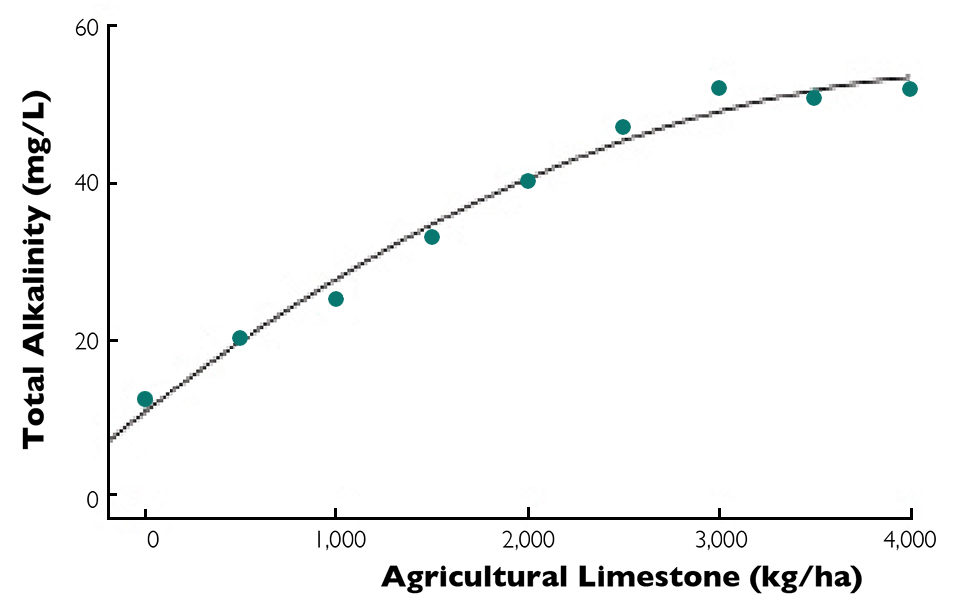
This technique can be illustrated for a trial to determine the liming rate necessary to increase pond water alkalinity at a particular farm to 50 mg/L. Several liming rates were applied singly, and alkalinity was measured. The plot of the liming rates versus alkalinity reveals that the necessary application rate is about 3,000 kg/ha (Fig. 1).

Although higher temperatures in tropical regions allow continuous cropping, there may be distinct wet and dry seasons, cool and warm seasons, or both. Moreover, weather conditions at any location differ from year to year. Treatments known to be sensitive to weather conditions should be conducted in different seasons or over more than one year.
Conditions can vary considerably among production units at the same facility. Thus it is important to select a group of experimental production units for trials that are as similar as possible in all respects. Ponds likely offer the greatest challenge in selecting similar experimental units. At many farms, ponds vary in size, depth, shape, orientation to the wind, bottom soil characteristics, age and even water source.
It is interesting to note that in fertilization experiments, ponds of identical area, depth and shape, built of the same kind of soil, located side by side and receiving identical amounts of the same fertilizer typically exhibit large variations in phytoplankton composition and abundance. Studies have shown that fish production varies considerably among such ponds, and one pond can have twice the production of another one.
The coefficient of variation for mean annual production in sunfish ponds treated with the same fertilizer regime at Auburn University ranged from 16 to 40 percent and averaged 28 percent over an eight-year period. The coefficient of variation for production in channel catfish ponds with feeding was much less, usually only 5 to 10 percent, because the fish obtained most of their nutrients from feed rather than the food web, which has its base in phytoplankton production.
Trial cost
The cost of conducting on-farm trials depends largely on the size of the experimental units. Application of a treatment is less expensive, and the economic loss that results from poor performance of a treatment are lower in small units than in larger ones. Large aquaculture facilities can construct small experimental units for conducting trials.
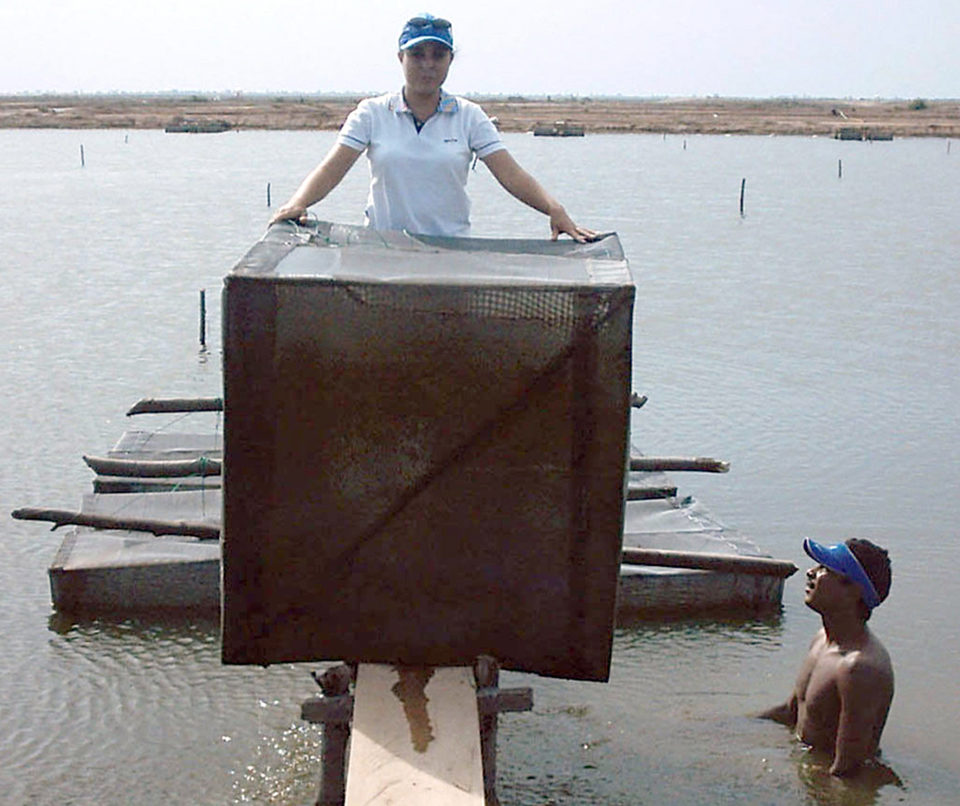
At research stations, experimental ponds typically are 200 to 1,000 m2 in surface area and 1.0 to 1.5 m in average depth. Such sizes are suitable for most on-farm trials. Some trials, such as investigations of feeds, can be conducted in small cages 1 to 2 m3 in volume placed in a single pond or other production unit.
Randomizing
Because of high variability, experimental units should be randomized so that each pond has an equal chance of receiving the control or a treatment. The ballot method is an easy way of randomizing controls and treatments among experimental units. Suppose a control and two treatments are to be randomized among 12 experimental units.
Each unit is assigned a number from 1 to 12. Write each number individually on a separate plastic chip or paper card and place the numbered chips or cards in a bag. Then write each of the letters C (control) and T-1 and T-2 (treatments) on four chips or cards placed into another bag.
To randomize, draw a chip or card from each bag. If chips with 7 and T-2 are selected, unit 7 will receive the treatment identified as T-2. The process is continued until all ponds have been assigned treatments or control status.
Data collection bias
In some cases, workers collecting data for on-farm trials may have bias about the outcome of the trial. Bias can unintentionally – or possibly intentionally – result in decisions that favor either the treatment or the control. This problem can be avoided by conducting “blind” trials in which individuals who collect the data do not know which units are controls and which are the treatments. Of course, for some treatments, such as comparison of one type of aerator versus another, it is not possible to conduct blind trials.
As water quality and growth rate data are collected during trials, it may quickly appear that either the control or the treatment is superior. On commercial farms, it can be tempting to stop the trial immediately, reject a treatment if it is inferior or widely adopt it if it is superior. This temptation should be resisted and the trial carried to completion.
In this way, the effects of the treatment on survival, net production, feed conversion and the size of culture animals at harvest can be properly evaluated. Moreover, the cost differences among the treatments and control can be compared to determine if the new product or method results in greater profitability.
Visual comparisons
In well-designed trials, one can sometimes ascertain if a treatment is superior to the control simply by visual comparisons among experimental units. For example, in the feed trial example shown in Table 1, variation among the four ponds in both the control and treatment 1 was low, and it is relatively certain that production in treatment 1 exceeded that of the control. However, variation was greater in treatment 2, and it would be unwise to conclude simply from looking at the data that treatment 2 was different from either the control or treatment 1.
Boyd, Example of a feed trial, Table 1
| Replication | Control Feed | Treatment 1 | Treatment 2 |
|---|
Replication | Control Feed | Treatment 1 | Treatment 2 |
|---|---|---|---|
| 1 | 4,100 | 5,500 | 5,825 |
| 2 | 3,600 | 5,600 | 3,810 |
| 3 | 3,750 | 5,725 | 4,700 |
| 4 | 3,925 | 5,410 | 5,750 |
| Mean | 3,844 | 5,559 | 5,021 |
Data in Fig. 1 gives a clear indication that a liming rate of 3,000 kg/ha is needed to obtain 50 mg/L total alkalinity, but had there not been such a consistent pattern of increase in alkalinity with increasing treatment rate, it would have been more difficult to ascertain the liming rate.
Statistical methods
Statistical methods can be used to assist in making decisions about differences in means or in interpreting dose-response curves. An overview of statistical methods for use in on-farm trials is too lengthy to present here. However, statistical software packages that greatly simplify statistical analyses are available.
One point about statistical analyses of on-farm trials should nevertheless be made. In traditional research, investigators often chose a probability level of 0.05 for declaring significant differences. If a treatment is different from the control at the 0.05 probability level, there is a 5 percent chance that the difference was the result of chance. Therefore there was a 95 percent chance the treatment was better than the control. A commercial producer likely would accept a lower probability level.
Most statistical procedures provide an estimate of the probability level with which a difference between means can be declared significant. If the statistical analysis of an on-farm trial indicates a treatment is different from the control at the 0.7 level, there is a 30 percent likelihood that the difference resulted from chance.
The producer could decide, based on the cost and degree of improvement achieved, whether to adopt a treatment that has a 70 percent likelihood of being better than the current method, the control. Another alternative is to conduct further trials of a new treatment when the probability level is large.
Maximizing production, profitability
In some cases, the new product or method evaluated may not increase production, or it could lessen production. Nevertheless, if the treatment is more profitable than the control, the producer probably should adopt the new product or method. In commercial aquaculture, there seems to be some confusion between maximizing production and optimizing profits, and some producers strive for the greatest production possible without giving adequate consideration to profitability.
(Editor’s Note: This article was originally published in the March/April 2013 print edition of the Global Aquaculture Advocate.)
Author
-

Claude E. Boyd, Ph.D.
Department of Fisheries and Allied Aquacultures
Auburn University
Auburn, Alabama 36849 USA
Tagged With
Related Posts

Innovation & Investment
Acoustic control improves feeding productivity at shrimp farms
In systems recently developed for shrimp farms, passive acoustic-based technology enables sensor-based control of multiple automatic feeders. Improved growth and feed conversion have been recorded at commercial farms using the technology.

Health & Welfare
Aiding gut health with a natural growth promotor
A study with Nile tilapia conducted in commercial production cages in Brazil showed the potential – in the absence of major disease threats – of a commercial, natural growth promotor that modulates the microbiota (inhibiting growth of pathogenic bacteria and promoting growth of beneficial bacteria) and inhibits quorum sensing.

Health & Welfare
Amino acid supplementation reduces protein levels in pangasius diets
Trials show that supplementation with amino acids could reduce protein levels from a typical 28 percent to 23 percent in pangasius diets.

Responsibility
Testing agricultural limestone in aquaculture ponds
This study of agricultural limestone from five different U.S. quarries determined that the samples had comparable chemical compositions but somewhat different solubilities in water. This procedure might be helpful in achieving better results when these products are used in the liming of aquaculture ponds.

