Lower costs, easy modification, transportability and reduced labor

Environmental regulations are resulting in reduced pollution limits for large fish hatcheries that can cause production reductions or even hatchery closures. This has led to more smaller, private fish farms providing fish for public stream stocking.
The U.S. state of West Virginia has many free-flowing groundwater sources from coal mines that can be used for biosecure, small-scale fish production. Economies of scale usually result in a higher cost of production for smaller producers, making it difficult to compete with larger operations.
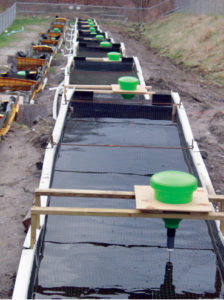
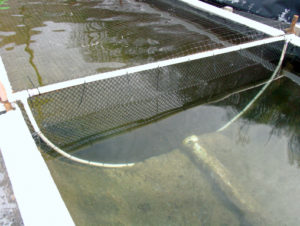
In a study funded by the Northeast Regional Aquaculture Center, the authors used water from a small mine water discharge to determine if producers could reduce their costs by using a new patent-pending “U”-shaped plastic tank for fish production.
The potential advantages of the plastic tanks include lower purchase and installation costs, easy modification, transportability that allows resale value and reduced labor for cleaning. The costs of the new tank were compared to those for the precast and poured concrete raceway systems most commonly used for trout production.
Tank comparison study
In November 2006, 10-cm-long rainbow trout fingerlings were stocked into 7,570-liter U-shaped tanks constructed with food-grade plastic and a similar-volume, flat-bottom concrete tank at two separate trout-rearing operations. Facilities at both locations had a history of normal trout growth.
Fish were fed a 42 percent-protein, 16 percent-fat commercial trout diet during the 31-week production cycle. Demand feeders were used at both sites. Nylon netting was used to deter aerial predators.
Average weight was measured at six-week intervals. Random samples of at least 50 fish were weighed with a commercial bench scale. As the trout approached marketable size, fin condition was recorded using a scale from zero (perfect) to 5 (over 90 percent missing or eroded) for each of the seven rayed fins. Each fish had a potential score of zero to 35.
Water quality data was monitored in the plastic tanks using a commercial instrument. Temperature, pH, oxygen and conductivity were recorded hourly. In the concrete system, a hand-held commercial oxygen meter was used to measure temperature and dissolved oxygen. Water samples from each site were analyzed by a certified analytical laboratory for anions and cations three times during the study.
The costs of purchasing, installing and cleaning the custom plastic tanks during the study were compared to the estimated costs of purchasing, installing and cleaning precast concrete tanks as well as poured concrete tanks. Businesses that specialize in building concrete tanks provided recent quotes for the cost estimates.
The labor costs for cleaning the plastic and concrete tanks were measured on five occasions during the last five months of the study. Annual labor demands for this task were estimated with this data.
Results

Critical water quality parameters remained stable at both sites for the most of the study. Water temperatures remained 11 to 15 degrees-C at both sites. Water analysis from both sites showed that all measured parameters were within the tolerance range of trout.
Water quality monitoring at each site showed the concrete tank had one low-oxygen event during the last week in May, which resulted in the precautionary removal of 400 trout (40 percent) from the system. The plastic tanks had two low-oxygen events in the lower tanks, one in May and one in June, due to the intrusion of a bear that diverted the water from the lower tanks. The upper two tanks were unaffected by this diversion of water.
Growth, fin condition and mortality data presented here are based on the average in the top two plastic tanks compared to the concrete tank. At the end of the study, average fish weight was based on a random sample of at least 50 fish from the approximately 1,000 fish stocked in each tank. The trout in the concrete tank showed better growth but also higher mortality than those in the plastic tanks (Table 1). There was no significant difference between the concrete and plastic tanks regarding the fin condition of the trout.
Miller, Growth, fin condition and mortality of trout, Table 1
| Tank Type | Volume m3 | Trout weight gain (g) | Growth (g/day) | Fin Score (0-35) | Mortality (%) | Culture Days |
|---|---|---|---|---|---|---|
| Concrete | 7.84 | 484 | 2.20 | 7.93 | 5.62 | 220 |
| Plastic | 7.57 | 382 | 1.75 | 8.08 | 3.96 | 219 |
A one-way analysis of variance was performed on the fin condition data using total fin condition scores. When the trout from the two plastic tanks were compared to the trout in the concrete tank, the procedure showed no significant (α < 0.05) difference in fin erosion between the two trout populations.
Maintenance, cleaning costs
Assuming labor costs at U.S. $10/hour and cleaning occurs every five days, an average of five cleanings during the study resulted in 3.4 hours/tank/year for cleaning, or $34/tank annually. The average cleaning for the concrete tank required 6.75 minutes. This translated into 8.2 hours/tank/year or $82/tank/year (Table 2).
Miller, Cost comparison for 10 concrete and plastic tanks, Table 2
| Tank Type | Cost (U.S. $) | Installation (U.S. $) | Cleaning (U.S. $) | Total (U.S. $) | Precast (%) |
|---|---|---|---|---|---|
| Precast concrete | 45,8509 | 6,000 | 820 | 52,670 | 100 |
| Poured concrete | 33,110 | 4,000 | 820 | 37,930 | 72 |
| HDPE plastic | 24,507 | 3,000 | 340 | 27,847 | 53 |
Although the manifold in the settling zone did not improve the solids retention in the plastic tank, it functioned very well by allowing hydrostatic water pressure to push the solids that accumulated around the manifold into the off-line solids removal pipe. Table 3 shows the various considerations used to compare the two tank materials.
Miller, Setup considerations, Table 3
| Characteristics | Concrete Tank | Plastic Tank |
|---|---|---|
| Purchase cost | Higher | Lower |
| Tank weight | 16.3 mt | 344.7 kg |
| Site preparation cost | Higher | Lower |
| Vulnerability | Low | Moderate |
| Installation | Critical | Critical |
| Easy modification | No | Yes |
| Useful life | 20 years | 20 years |
| Waste removal | Slower | Faster |
| Flexibility | None | Some |
| Prod. volume (l) | 7,570 | 7,570 |
| Size restrictions | Customized | Maximum diameter 1.52 m |
| Outside use | No restrictions | 51 cm set in ground |
| Inside use | No restrictions | HDPE cross bars |
| Resale/transfer | More difficult | Less difficult |
Versatile, cost-effective approach
The food-grade plastic tanks used in this research appear to be suitable for quarantine, fingerlings and grow-out in flow-through or recirculating systems. The development of improved screens and crowding systems can improve system performance.
These plastic tanks are presently limited to a maximum diameter of 1.5 meters. Concrete tanks can be made into nearly any size or shape. Although extremely resilient, the plastic tanks should be set into the ground 51 to 61 cm for stability. If used indoors on a hard floor, plastic feet can be added to stabilize the tanks.
The total cost of the plastic tank system was estimated to be approximately 53 percent of that for a precast concrete system and 72 percent of the cost for a poured concrete system with similar production volume.
The equipment and skills used to install the plastic tanks are more commonly available than for concrete tanks. The modular nature and durability of the tanks allows them to be easily moved and reset as needed.
The time required to clean the plastic tanks was 41 percent of that required to clean the flat-bottom concrete tanks. This was attributed to the design of the quiescent zone. Labor savings were estimated to be U.S. $9,600 over the expected 20-year life span of a 10-tank system.
(Editor’s Note: This article was originally published in the January/February 2009 print edition of the Global Aquaculture Advocate.)
Now that you've finished reading the article ...
… we hope you’ll consider supporting our mission to document the evolution of the global aquaculture industry and share our vast network of contributors’ expansive knowledge every week.
By becoming a Global Seafood Alliance member, you’re ensuring that all of the pre-competitive work we do through member benefits, resources and events can continue. Individual membership costs just $50 a year. GSA individual and corporate members receive complimentary access to a series of GOAL virtual events beginning in April. Join now.
Not a GSA member? Join us.
Authors
-
Daniel Miller
Davis College of Agriculture Forestry and Consumer Sciences
West Virginia University
1170 Agricultural Sciences Building
P. O. Box 6108
Morgantown, West Virginia 26506-6010[117,100,101,46,117,118,119,64,49,51,101,108,108,105,109,100]
-
Gerard D’Souza
Davis College of Agriculture Forestry and Consumer Sciences
West Virginia University
1170 Agricultural Sciences Building
P. O. Box 6108
Morgantown, West Virginia 26506-6010
Tagged With
Related Posts

Intelligence
A land grab for salmon (and shrimp) in upstate New York
The operators of Hudson Valley Fish Farm see their inland locale as a pilot to prove that land-based fish farming, located in close proximity to major metropolitan markets, can be successful.

Innovation & Investment
A review of unit processes in RAS systems
Since un-ionized ammonia-nitrogen and nitrite-nitrogen are toxic to most finfish, controlling their concentrations in culture tanks is a primary objective in the design of recirculating aquaculture systems.

Health & Welfare
Acclimating shrimp postlarvae before pond stocking
Shrimp postlarvae acclimation before stocking into the various growout systems (ponds, raceways, tanks) is a critical – and often overlooked, sometimes taken for granted – step in the shrimp culture process. Various water quality parameters should be changed slowly so that the young shrimp have the time to gradually adapt to the new conditions.

Health & Welfare
Asepsis key to prevent contamination in shrimp hatcheries
Maintaining biosecurity and asepsis in larval shrimp production is a key component of the production chain in Ecuador, which requires the production of 5.5 billion larvae monthly from 300-plus hatcheries.


