Successful development, testing of multispectral imaging system
Consumption of fish is an essential part of a balanced human diet. However, fish quality deteriorates rapidly during post-mortem storage. Because of the importance of quality and safety assurance, this issue has received much attention from the food industry, consumers and governing authorities.
Psychrotrophic (capable of reproducing and growing in the cold) microbes can grow at low temperatures (below 5 degrees-C), and are found in different refrigerated foods including seafood. These microorganisms affect the food quality by secreting extracellular enzymes that affect and decrease the shelf-life of meat and seafood products. Hence, the evaluation of these microorganisms can be especially importance for ensuring the food safety and quality of refrigerated foods.
However, the use of traditional methods (plate count agar) for detection and measurement of psychrotrophic bacteria takes a long time – the incubation time is normally 7 to 10 days – and therefore it is important to develop a rapid detection methods for psychrotrophic microorganisms.
Hyperspectral imaging (HIS, technology that collects and processes information from across the electromagnetic spectrum to find objects, identify materials or detect processes) is a non-destructive and rapid technique that has shown much potential to evaluate food quality and safety, and has already been used to assess various fish freshness indicators. The technique of psychrotrophic plate count (PPC) has been used to detect bacterial contamination in other meat products. However, to the best of our knowledge, our study reports the first application of the HSI method to measure PPC in refrigerated rainbow trout fish fillets.
Because of the complexity of quality deterioration in fish flesh, relying on a single freshness indicator cannot provide a reliable prediction for fish quality and safety. Thus, the evaluation of quality and shelf-life in meat and seafood products can be more accurate when combined chemical, microbiological and sensory parameters are considered.
This article – adapted and summarized from the original publication (Khoshnoudi-Nia, S., Moosavi-Nasab, M. 2019. Prediction of various freshness indicators in fish fillets by one multispectral imaging system. Sci Rep 9, 14704) – reports on a study to develop and evaluate a simple multispectral imaging system to simultaneously evaluate the chemical, microbial and sensory scores of rainbow trout (Oncorhynchus mykiss) fillets and improve quality prediction.
Study setup
Forty freshly sacrificed rainbow trouts (Oncorhynchus mykiss) with an individual weight range of 0.75 to 1.2 kg and from the same production batch were purchased from a local aquaculture farm in Bajgah (Shiraz, Fars, Iran) and transported to the Seafood Processing Research Group Laboratory, School of Agriculture, Shiraz University (Shiraz, Iran). The fish were processed and fillets cut to 8 cm × 4 cm × 1 cm pieces, producing 210 subsamples. These were randomly divided into seven groups containing 30 subsamples. These groups were stored at 4 ± 2 degrees-C for 0, 2, 4, 6, 8, 10 and 12 days to represent the changes of fish muscle from freshness to spoilage, and then used for analyses.
The hyperspectral images were obtained using a Hyper Spectral Imaging (1000) spectrograph (Opt Co., Kashan, Iran). The spectrograph covered the waveband considered for our analysis, in the range of 430 to 1010 nm.
For detailed information on fish fillet preparation; acquisition and calibration of hyperspectral images; determination of reference data set; PPC values; Total Volatile Basic Nitrogen (TVB-N) content; sensory evaluation; average-spectra extraction and pre-processing; optimal wavelength selection; chemometric analysis; model evaluation; and visualization of freshness information, refer to the original publication.
Results and discussions
In our study we developed a multispectral imaging system (which captures image data within specific wavelength ranges across the electromagnetic spectrum and extracts additional information the human eye cannot capture; the technology was originally developed for military uses) to evaluate the chemical, microbial and sensory quality of rainbow trout fillets during cold storage over time, and compared the predictive power of various linear and non-linear models to evaluate TVB-N, PPC and sensory scores as freshness indicators.
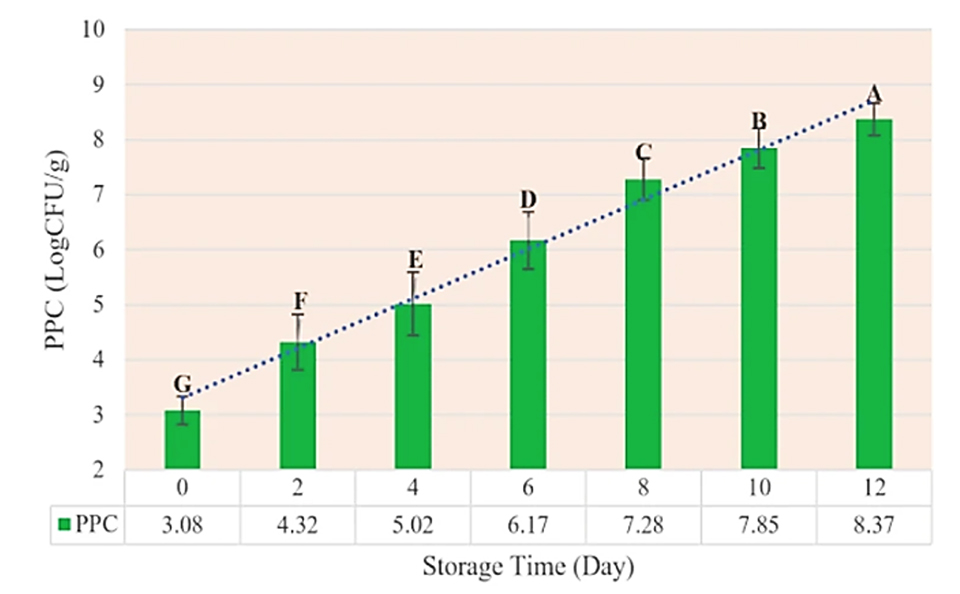
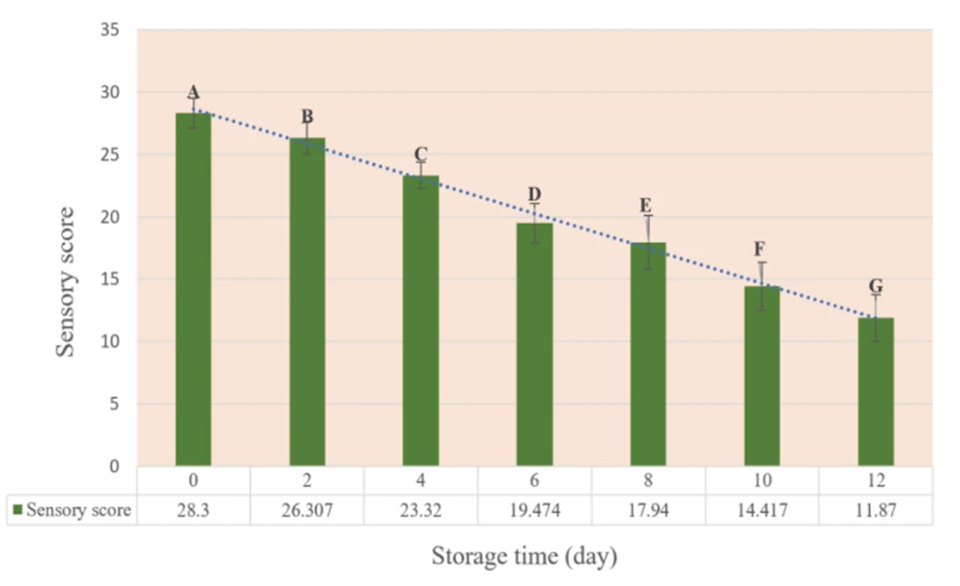
The results of changes in sensory scores, PPC and TVB-N values in 210 rainbow trout fillet samples during 12 days of cold storage are illustrated in Fig. 1. Overall, endogenous enzymatic and microbial activities are the most important causes for the postmortem degradation of fish fillets and for decreasing their sensory acceptance by consumers.
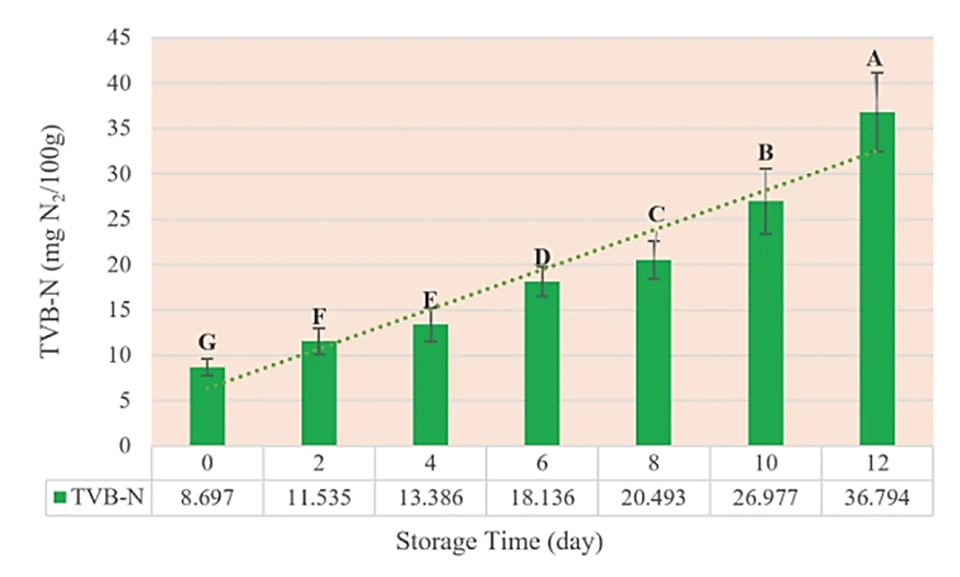
Our initial TVB-N value was 8.7 ± 0.9 mg Nitrogen/100 grams, which is comparable with other data reported by previous authors for rainbow trout fillets. During storage, this value increased to 36.8 ± 4.4 mg N/100 grams, and because the acceptable level of TVB-N values in fresh fish is 20 mg N/100 grams, the shelf life of our rainbow trout fillets was eight days at 4 degrees-C. A wide range of input data is an important factor to build an accurate, stable and robust calibration model. The TVB-N values were 38.8 (7.31 to 46.11 mg N/100 grams) and 35.46 (7.65 and 43.11 mg N/100 grams) for calibration and prediction sets, respectively, which were suitable ranges for establishing a robust prediction model.
We consider psychrotrophic microbes to be the most important factor responsible for the quality deterioration of seafood. For this reason, we evaluated the PPC value – a significant freshness indicator – in our study. The initial PPC value of the rainbow trout fillets was 3.08 ± 0.26 log10CFU/g, which increased with increasing storage time and finally reached 8.37 ± 0.29 log10CFU/g on the 12th day. The initial PPC was similar or higher than those values reported in other studies. These differences may be due to the type of nutrition, gender, fish production environment, fish size and other factors.
The limit of acceptability for the PPC of fish is considered 7 log10CFU/gram. Based on this threshold, the samples were unacceptable after 8 days cold storage. Furthermore, the variation range of PPC for calibration and prediction sets were 6.14 (2.74 to 8.88) and 5.29 (2.82 to 8.74) log10CFU/gram, respectively, which are wide enough to establish a suitable model for prediction of PPC in rainbow trout fillets.
The shelf life of fish, like for other foods, is highly related to consumer sensory acceptability. The results of our sensory score for rainbow trout fillet samples are presented in Fig. 1C. Similar to other indicators, time had a significant effect on this factor (p < 0.05) and the sensory score showed a declining trend with increasing storage time, so that within eight days the total sensory score went from 28.3 to 17.94, just below the acceptable threshold of 18. Therefore, based on our sensory analysis data, the shelf life was nearly eight days. The results were consistent with previous findings for TVB-N and PPC, and the correlations between TVB-N and sensory scores, and between PPC and sensory scores, were negative and strong.
Near infrared spectroscopy (NIR-Spectroscopy) is a technology based on the absorption of light by molecules and provides valuable information about the chemical composition and bonding in fish flesh. Fig. 2 illustrates the reflectance spectra plot of fish fillets based on different storage time intervals: With increasing time, the magnitude of the spectral reflectance curves increased. This is probably because the undecomposed chemical components of fish flesh have a lower reflectance than decomposed components produced during storage time. Also, several obvious absorption bands were recognizable on the spectra plot of samples. In general, the bands in the visible range, 400 to 700 nm, (e.g. ∼440, 500, 560, 600 and 650 nm) are probably related to the absorption of pigments of the fish flesh.

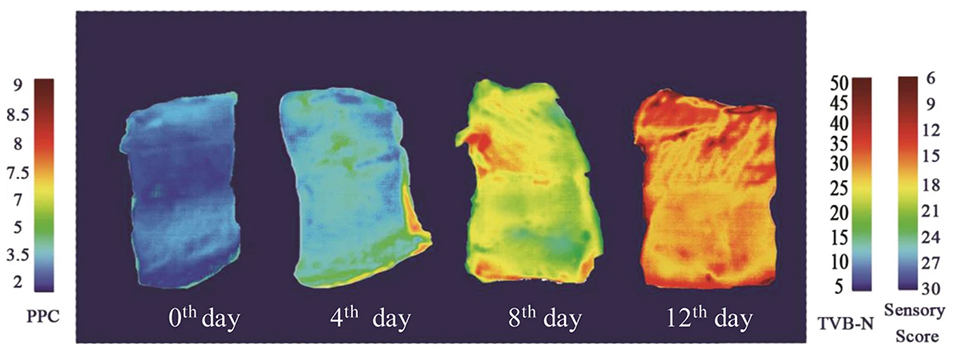
Visualization of the freshness indicators as a pseudocolor map is the final and the most important stage in hyperspectral imaging system and provides a superior advantage to HSI over traditional spectroscopy. Fig. 3 shows four examples of distribution maps of fish fillet samples at different storage times (0, 4, 8 and 12 days). The changes in PPC, TVB-N values and sensory scores are indicated sample by sample, and by location in the same sample. A linear color scale shows the quality status in various location of the fish flesh during storage time. In this color bar, blue and red colors represent the best (low values of PPC, TVB-N and high sensory score) and the worst quality status of fish fillets, respectively.
Because of the different speeds of chemical and microbial degradation of various compounds, the freshness, and the quality of different locations in a fillet sample is not uniform. As a result, the color distribution in the map is not homogeneous, indicating the various degrees of TVB-N, PPC values and sensory scores in different regions of the same fish fillet. For example, in the first day of storage, most pixels are dark blue indicating high quality (low PPC and TVB-N values and high sensory score) of the fillets. During the spoilage process, the color of pixels changes, and on the last day of storage, most pixels had changed to red color.
Perspectives
We successfully developed and applied to rainbow trout fillets a hyperspectral imaging technique system (432 to 1010 nm) coupled with various linear and nonlinear models to evaluate PPC, TVB-N values and sensory scores, three essential fish freshness and quality indicators.
The results showed that the prediction performance of nonlinear models was better than nonlinear ones for evaluating the freshness quality of rainbow trout fillets. The best predictive power was obtained for PPC values, followed by sensory scores and TVB-N contents. The use of the multispectral imaging method as a non-destructive and rapid technique to estimate fish fillets quality has several advantages, including relatively fast results.
Overall, the results of our study showed that the use of multispectral imaging coupled with chemometric models that extract information from chemical systems, especially non-linear ones, is a promising method to predict PPC, TVB-N contents and sensory scores in rainbow trout fillets. This technique can replace the traditional, longer-time analyses.
References available in the original publication.
Now that you've finished reading the article ...
… we hope you’ll consider supporting our mission to document the evolution of the global aquaculture industry and share our vast network of contributors’ expansive knowledge every week.
By becoming a Global Seafood Alliance member, you’re ensuring that all of the pre-competitive work we do through member benefits, resources and events can continue. Individual membership costs just $50 a year. GSA individual and corporate members receive complimentary access to a series of GOAL virtual events beginning in April. Join now.
Not a GSA member? Join us.
Authors
-
Dr. Sara Khoshnoudi-Nia
Seafood Processing Research Group
School of Agriculture, Shiraz University
Shiraz, Iran[114,105,46,99,97,46,117,122,97,114,105,104,115,64,105,100,117,111,110,104,115,111,104,107,45,115]
-
Dr. Marzieh Moosavi-Nasab
Seafood Processing Research Group & Department of Food Science and Technology
School of Agriculture, Shiraz University
Shiraz, Iran
Tagged With
Related Posts

Innovation & Investment
Can IoT tool help fish farmers sleep better at night?
Berlin-based Monitorfish wants to enable fish farmers to keep a close watch on their stocks from their smartphones, another Internet of Things solution for producers.

Intelligence
Effect of freeze-thaw cycles on quality of Pacific white shrimp
Study evaluates the effects of freeze-thaw cycles on moisture migration, protein degradation, microstructure and quality of Pacific white shrimp.

Innovation & Investment
Little fish in a big pond: Minnowtech aims to give fresh vision to shrimp inventory
Because shrimp farmers lack accurate in-pond inventory, startup Minnowtech is on the verge of offering a data-driven solution. It’s got something to do with jellyfish.

Health & Welfare
Near-infrared spectrometers determine stage maturity in channel catfish
This study evaluated the feasibility of a portable, hand-held micro near-infrared spectrometer to objectively determine the stage of maturity in channel catfish. Such a rapid, non-invasive method to stage fish maturity in hatcheries would improve the efficiency of hatchery production.


