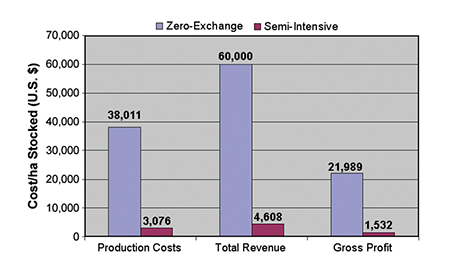
Gross profit generated by new technology on a per-hectare basis was significantly higher

In addition to establishing a successful demonstration site for zero-exchange shrimp production, the Nicaragua Small Shrimp Producer Assistance Program recently projected budgets for a typical Nicaragua semi-intensive shrimp farm and zero-exchange farm. The program was designed to help the country’s shrimp farmers recover from disease problems and the devastation caused by Hurricane Mitch.
Financial information for 1994-1999 was considered as the baseline production period for the comparison. Consideration of the Taura Syndrome Virus, El Niño drought, Hurricane Mitch, and outbreak of White Spot Syndrome Virus that took place in those years was deemed necessary to objectively evaluate shrimp farm viability in Nicaragua.
Semi-intensive farm

For the baseline farm, the following characteristics were noted: an average grow-out phase of 134 days, stocking density of 18.16 PL per square meter, survival rate of 32 percent, and average shrimp harvest size of 12.96 g (head-on). An average of 2.04 production cycles per year and FCR of 1.81:1 were assumed. The typical semi-intensive farm using current technology had a cost per pound (head-on) of U.S. $2.00, resulting in a net return of $0.17 per pound at a market price of $2.17 (Table 1).
Zero-exchange system
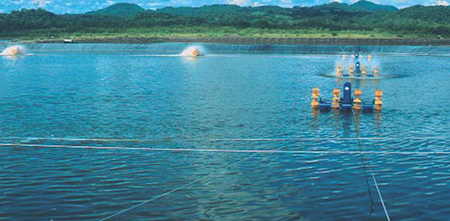
A hypothetical zero water-exchange system using production rates from the demonstration project was designed to achieve a production level of 470 metric tons (MT), an average production for current farms. A 26-ha zero-exchange system with 52 0.5-ha ponds would be required to generate this production, compared to 324 ha for a semi-intensive farm. Total investment requirements for feeding, permanent equipment, and other construction costs were U.S. $2,815,622 or $108,957 per hectare. Total annual depreciation was U.S. $386,152 or $14,943 per hectare.
Lopez, Cost and return budget for typical semi-intensive shrimp farm, Table 1
| Actual Cost 2 Cycles | Annual/Harvested lb | /Seeded ha |
|---|
Actual Cost 2 Cycles | Annual/Harvested lb | /Seeded ha | |
|---|---|---|---|
| Pounds harvested | 1,033,661 | ||
| Price/lb | 2.17 | ||
| Total revenue | 2,247,386 | 2.17 | 3,339 |
| Operating expenses | |||
| Postlarvae | 484,639 | 0.47 | 720 |
| Feed (incl. shipping) | 479,523 | 0.46 | 713 |
| Chemicals/fertilizer | 61,195 | 0.06 | 91 |
| Direct labor | 64,731 | 0.06 | 96 |
| Indirect costs | 979,746 | 0.95 | 1,456 |
| Total expenses | 2,069,834 | 2.00 | 3,076 |
| Gross profit | 177,552 | 0.17 | 264 |
Production parameters

The assumptions used for estimating production costs and revenues for the two farms are shown in Table 2. It was estimated a production of 9.1 MTper hectare per cycle could be achieved by applying optimum production practices of the zero-exchange intensive technology. In the 26-ha system, average survival rate of 55 percent and average harvest size of 13.50 g would be required to meet the annual production objective. In contrast, a 324-ha farm using semi-intensive technology would be required for this production.
Stocking density varied between the two systems: 122 PL per square meter for the zero water-exchange system and 18 PL per square meter for the semi-intensive system. The two systems were assumed to operate two cycles per year. The market price for shrimp was assumed to be U.S. $3.00 per pound.
Lopez, Performance comparison of a typical semi-intensive farm, Table 2
| Semi-Intensive | Zero-Exchange |
|---|
Semi-Intensive | Zero-Exchange | |
|---|---|---|
| Annual production | 1,033,661 | 1,033,661 |
| Yield/cycle (lb/ha) | 1,567 | 20,000 |
| Production area (ha) | 324 | 26 |
| Number 0.5-ha ponds | – | 52 |
| Cycles | 2 | 2 |
| Stocking density | 18 | 122 |
| Survival rate (%) | 32 | 55 |
| Harvest size (g, head-on) | 12.98 | 13.50 |
| Price/lb (head-on) | 3.00 | 3.00 |
Economic comparison

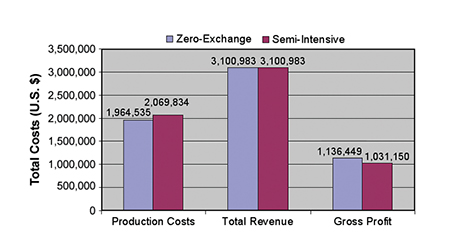
Both systems yielded the same level of production and received the same market price, so they generated the same total revenues. However, the zero water-exchange system resulted in lower total operating costs, thereby generating a higher gross profit than the semi-intensive system (Fig. 1). The lower production costs indicated the zero-exchange system can be more cost-efficient than typical semi-intensive systems.
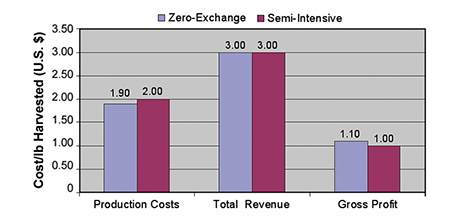
On a per-harvested lb basis, the zero water-exchange technology provided a small ($0.10) profit difference when compared to the semi-intensive system (Fig. 2). However, the gross profit generated by the zero water-exchange technology on a per-hectare basis (Fig. 3) was significantly higher. Annual profit per seeded hectare for the zero-exchange system was U.S. $21,989, whereas the same value for the traditional system was $1,552.
(Editor’s Note: This article was originally published in the December 2002 print edition of the Global Aquaculture Advocate.)
Now that you've finished reading the article ...
… we hope you’ll consider supporting our mission to document the evolution of the global aquaculture industry and share our vast network of contributors’ expansive knowledge every week.
By becoming a Global Seafood Alliance member, you’re ensuring that all of the pre-competitive work we do through member benefits, resources and events can continue. Individual membership costs just $50 a year. GSA individual and corporate members receive complimentary access to a series of GOAL virtual events beginning in April. Join now.
Not a GSA member? Join us.
Authors
-
Mayra López
Graduate Student
Food and Resource Economics Department
IFAS – University of Florida, Florida, USA -
Russ Allen
President
Aquatic Designs, Inc.
Okemos, Michigan, USA -
Charles Adams, Ph.D.
Professor
Food and Resource Economics Department
IFAS – University of Florida, Florida, USA -
Jim C. Cato, Ph.D.
Director
Florida Sea Grant College Program
University of Florida, Florida, USA
Related Posts

Health & Welfare
‘Super male’ Nile tilapia outperform hormone-reversed fish in Nicaragua
A recent study compared the growth and survival at different salinity levels of “super male” (YY) tilapia with normal sex O. niloticus reversed to 100 percent phenotypic males.

Aquafeeds
Analyzing aquaculture through Alltech’s Global Feed Survey
Alltech’s eighth annual Global Feed Survey, a compilation of estimated feed production data, reported that aquafeeds grew globally by 4 percent.

Health & Welfare
Stirling researcher preps eyestalk-ablation alternative trials
University of Stirling Ph.D. student Simão Zacarias, who is from is Beira, Mozambique, will soon travel to Isla del Tigre, Honduras, to document evidence showing the benefits of breeding shrimp without eyestalk ablation. His is a journey of hopeful discovery.

Health & Welfare
Necrotizing hepatopancreatitis: Diagnosis, distribution in shrimp
Necrotizing hepatopancreatitis has become one of the most important bacterial diseases affecting shrimp farming in the Americas.


