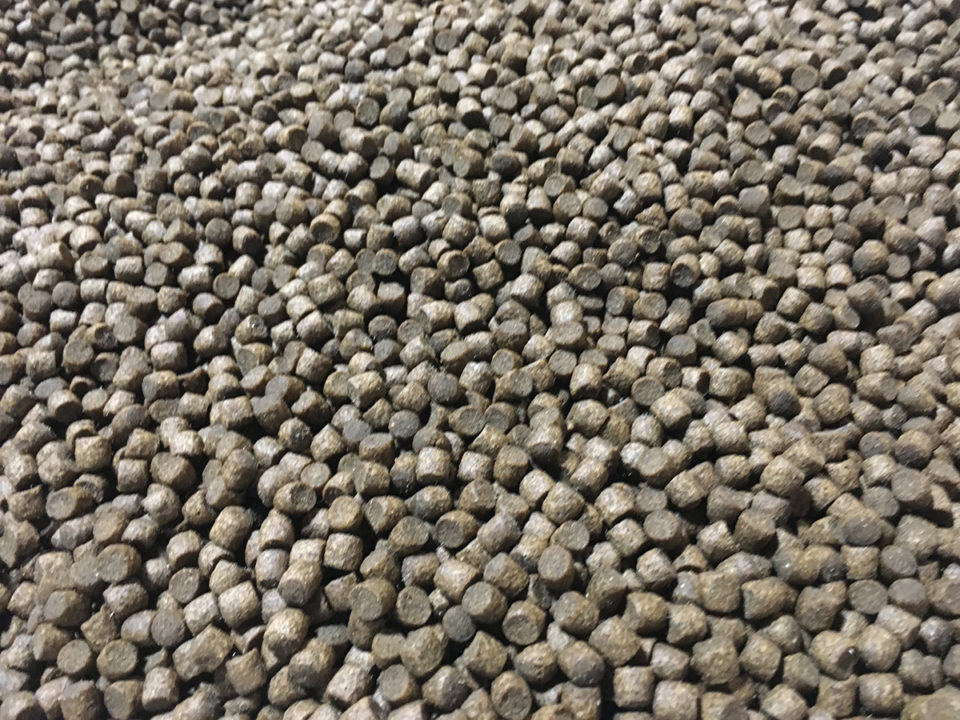
About half of global fish and shrimp production is based on manufactured feeds

Aquaculture often is promoted on the basis of its importance to global animal protein production. According to the Food and Agriculture Organization of the United Nations, fishery products account for around 17 percent of the global, human population’s intake of animal protein and 6.7 percent of all proteins consumed by humans. Aquaculture provides about 50 percent of edible fisheries products, and it probably supplies around 8 to 9 percent of animal protein consumed by humans.
Proteins are made of amino acids which are organic acids with an amino group (NH2) and an organic component. The formula for the simplest amino acid (glycine) is C2H5NO2. There are 20 to 22 amino acids that combine together to form large, complex protein molecules. Human protein contains 20 different amino acids.
Protein contains an average of 16 percent nitrogen. The factor 100 percent divided by 16 percent or 6.25 can be multiplied by the percentage nitrogen in plants or animal material to estimate protein concentration. Animal and plants contain some non-protein nitrogen, so percentage nitrogen multiplied by 6.25 is called crude protein.
Amino acids are made by plants and synthesized into plant protein. Plants or plant parts are eaten by wild animals, grazed by livestock, used as human food, or processed into livestock and aquaculture feed ingredients. The amino acids in plant proteins are absorbed by animals that eat plants and converted to animal proteins. The protein contained in fish meal and animal by-product meals included in animal feeds also originated from plant material. Humans can live on an all-plant diet, but they must carefully select dietary items in order to obtain certain amino acids necessary in human diets but in short supply in many plants. Animals have a higher protein concentration than plants, and animal protein is better balanced in amino acid composition for human needs than is plant protein. Thus, diets of most humans contain some animal protein.
Because protein is so important globally as a nutrient, the efficiency of protein use is of concern to those interested in environmental sustainability. In extensive aquaculture production, fertilizers are applied to ponds to increase nitrogen and phosphorus concentrations, and ammonia nitrogen and nitrate from fertilizers is used by plants in making amino acids and protein.
Efficiency of nitrogen use
The efficiency of nitrogen use in this process can be illustrated using the results of a pond fertilization study in which a total of 117 kg per hectare (ha) of fertilizer nitrogen was applied and 1,109 kg per ha of tilapia biomass (2.22 percent nitrogen, live weight basis) were harvested. The harvested fish contained 24.6 percent of the fertilizer nitrogen. Tilapia fillets account for only about 35 percent of fish weight, and they usually contain around 18.5 percent protein (2.96 percent nitrogen). The recovery of fertilizer nitrogen in tilapia fillets in this instance was 9.8 percent.
The common indicators of feed use efficiency are the feed conversion ratio (FCR) calculated by dividing feed applied by net fish production and the feed ratio efficiency (FER) which is the inverse of the FCR. In other words, the FCR indicates the weight of feed necessary to give 1 kg of aquacultural production, while the FER indicates the weight of aquaculture production resulting from 1 kg of feed.
Aquaculture feeds vary greatly in crude protein concentration, because herbivorous species require less protein in their diets than do omnivorous and carnivorous species. Most feeds will fall within the range of 25 to 40 percent crude protein. According to the Alltech Global Feed Survey 2018, about 40 million metric tons of aquaculture feed were produced in 2017. This feed likely contained at least 12 million metric tons (MT) of protein.
The global FCR for feed-based aquaculture is not known, but assuming it is around 1.7, 40 million metric tons of feed would result in nearly 24 million MT of aquaculture animals. Thus, excluding bivalve mollusk production, about half of global fish and shrimp production is based on feeds.
Calculating protein conversion ratio
The efficiency of protein use may be calculated as the protein conversion ratio (PCR) as follows:
PCR = FCR X % feed protein, divided by 100
The PCR reveals the ratio of feed protein to aquatic animal production. For example, at an FCR of 1.5 and a 35 percent protein shrimp feed, PCR = 0.52 and 0.52 kg of feed protein would be necessary for 1 kg shrimp. The efficiency of conversion of feed protein to aquatic animal protein is estimated by the protein efficiency ratio (PER) as shown below:
PER = FCR X % feed protein, divided by % protein in culture species
Shrimp are around 17 percent crude protein, so for our example, 309 kg of feed protein is necessary for 1 kg of shrimp protein. Neither of the above protein efficiency indicators are related to the aquaculture protein contained in human diets. Consider a tilapia cage culture example in which the FCR is 1.7, feed is 32 percent crude protein (5.12 percent nitrogen), and live fish contain 2.22 percent nitrogen or 13.9 percent crude protein. Production of 1,000 kg fish containing 139 kg crude protein would require 1,700 kg feed containing 544 kg crude protein. The conversion of feed protein to fish protein would be 25.6 percent.
Tilapia have a fillet yield of about 35 percent and the fillets contain about 18.5 percent protein. One MT (1,000 kg) of live fish would yield 350 kg of fillets containing 64.75 kg protein, and 11.9 percent of the feed protein would be recovered in fillets.
Protein contains nitrogen in direct proportion to its weight. The percentage recovery of feed nitrogen would be the same as for feed protein. It is interesting to note that in the example for fertilized tilapia ponds, the recovery of fertilizer nitrogen in fish was about the same as for feed nitrogen.
Plant meals used in aquaculture feed ingredients require nitrogen for their production. It has been estimated that about 6.62 kg fertilizer nitrogen is used in the production of plant-derived ingredients included in 1 metric ton of the average tilapia feed. The feed for 1,700 kg of tilapia would actually represent a total of 555.25 kg nitrogen – slightly more than the 544 kg contained in it. This increase would not seriously reduce protein conversion efficiency.
A recent book, “Aquaculture, Resource Use and the Environment” (Wiley-Blackwell 2015) contained data on protein conversion by five aquaculture species (Table 1). Protein recovery in whole fish ranged from 25.9 percent in tilapia to 43.0 percent in Atlantic salmon with an average of 30.9 percent. The range for recovery of protein in fillets were 11.9 percent in tilapia to 33.3 percent in salmon with an average of 19.4 percent. Fertilizer nitrogen used in producing feed ingredients were not included in these estimates.
Boyd, PCE, Table 1
| Species | FCR | Feed crude protein (%) | Dress-out as fillets (%) | Crude protein (%) fillet | Crude protein (%) whole fish | Protein recovery (%) fillet | Protein recovery (%) whole fish |
|---|
Species | FCR | Feed crude protein (%) | Dress-out as fillets (%) | Crude protein (%) fillet | Crude protein (%) whole fish | Protein recovery (%) fillet | Protein recovery (%) whole fish |
|---|---|---|---|---|---|---|---|
| Catfish | 1.8 | 32 | 45 | 15.55 | 14.9 | 12.1 | 25.9 |
| Tilapia | 1.7 | 32 | 35 | 18.50 | 14.0 | 11.9 | 25.7 |
| Shrimp | 1.5 | 38 | 37 | 20.31 | 17.8 | 13.0 | 31.2 |
| Trout | 1.2 | 45 | 69 | 20.87 | 15.6 | 26.7 | 28.9 |
| Salmon | 1.0 | 42 | 72 | 19.90 | 18.5 | 33.3 | 43.0 |
Perspectives
The overall conversion efficiency of plant protein to animal protein (including pasture animals) has been estimated at 8.3 percent globally. The whole animal conversion for feed-based production is around 35 percent for chickens, 20 percent for swine, and 10 percent for beef. The corresponding efficiencies of conversion of feed protein to edible meat are 20 percent, 10 percent, and 4 percent, respectively. Feed protein conversion by feed-based aquaculture production is of about the same efficiency as obtained in chicken production.
Author
-

Claude E. Boyd, Ph.D.
School of Fisheries, Aquaculture and Aquatic Sciences
Auburn University
Auburn, Alabama 36849 USA
Tagged With
Related Posts

Health & Welfare
Algae shows promise as alternative DHA source in rainbow trout diets
A growth trial in Canada evaluated the use of algae biomass to increase the concentration of long-chain polyunsaturated fatty acids in the tissues of rainbow trout.

Aquafeeds
Algae alternative: Chlorella studied as protein source in tilapia feeds
Chlorella and other species have potential as protein sources in aquafeeds. In trials with tilapia fry raised in a recirculating system, the fish received a fishmeal-based control diet or feeds with portions of the fishmeal replaced by Chlorella.

Aquafeeds
Analyzing the hydrostability of shrimp feeds
The physical integrity and nutrient leaching of shrimp aquafeeds are important aspects in their quality control. The water stability of shrimp aquafeeds is often evaluated in various subjective manners. This analytical procedure provides a baseline for the aquafeed manufacturer to assess product quality.

Aquafeeds
Talent show: Aquafeed companies show off at F3
Aquafeed manufacturers and alternative feed ingredient suppliers from all over the world gathered in Silicon Valley for F3, the Fish Free Feed contest. In the hub of innovation, solutions to a global problem were on full display.

