Astaxanthin levels and muscle hardness also recorded

Lipid level is the main factor that affects the flavor and texture qualities of salmon. It also affects pigmentation and color evaluation, the main parameters involved in salmon classification and overall acceptability for consumers.
Studies carried out with Atlantic salmon and rainbow trout have indicated that the distribution of lipids in fish tissue varies widely with species, type of muscle, and portion of muscle. Research in this area has been largely limited to a small number of species and a few discrete areas of the fish, typically not the whole fillets.
When comparing populations or samples, it is clearly necessary to specify the area of sampling and procedures used when determining the muscle lipid content of a fish species. Further studies that allow standardizing and/or manipulating of the quality characteristics of farmed salmon will likely contribute to the economic value of the product.
Salmon study
Lipid content, pigmentation, and color – which vary with genetic background, feeding practices, pigmentation regime, fish age and live weight – are some of the most important characteristics used to classify salmon fillets. Because Japanese market demands for quality salmon products are a very important issue with coho salmon, and technical information on this species is limited, EWOS Innovation-Chile, the University of Chile, and DSM Nutritional Product, Chile S.A. collaborated in a study to produce a “quality map” for coho salmon fillets.
The study was conducted to describe the distribution of lipid content, astaxanthin, color, and texture in coho salmon fillets of different live weights, and to establish the correlations among these meat quality attributes.
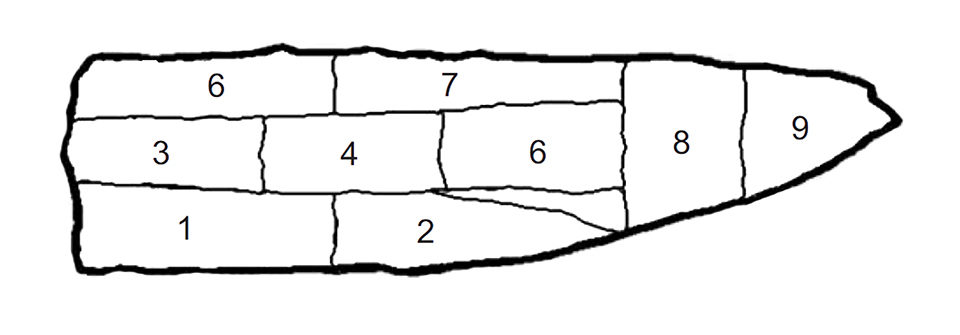
Coho salmon were raised in sea cages and fed a standard commercial diet. The right-side fillets from 28 fish randomly selected at 1, 2, and 3 kg live weight were used in the analysis. Each fillet was sectioned to produce nine standard portions/fillet (Table 1). Each portion was measured for color visually and by instrument. Astaxanthin levels, lipid content, and muscle hardness were also recorded.

Color, pigmentation
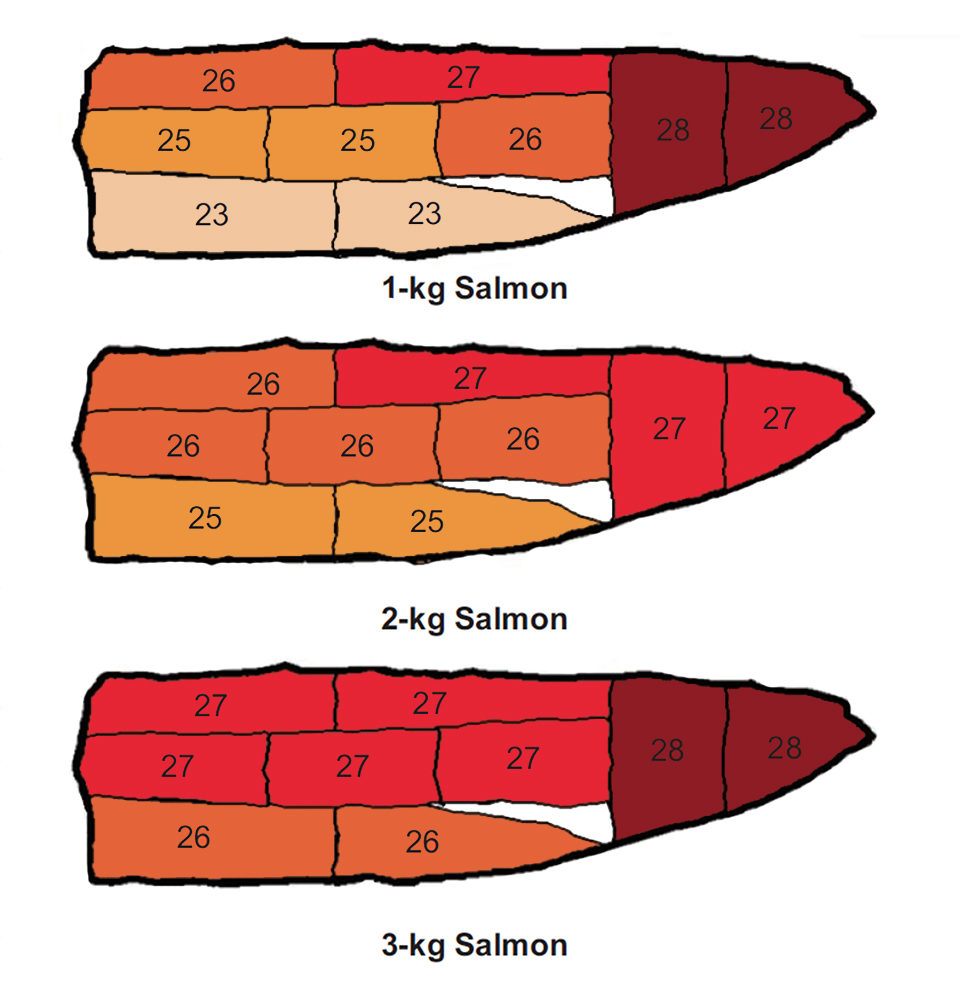
Applying the SalmoFan color scale to evaluate salmon flesh coloration, the caudal zone was the area of highest color and pigmentation at all the fish weights (Fig. 1). At all sampling times, the belly flap region showed the weakest color, and the middle line showed more uniformity as fish weight increased. Astaxanthin deposition increased up to 2 kg. Thereafter in heavier fish, it diminished in all portions except 6 and 7, which had a slight but significant increase (Fig. 2).
Astaxanthin deposition, color, and muscle hardness increased from the anterior toward the caudal zone of the fillets. Pigmentation was negatively correlated with lipid content, and visual color was significantly correlated with astaxanthin level.
Lipid content, distribution
Lipid deposition generally increased with live weight for all fish sections. Mean values obtained for the varied lipid content of the nine portions are shown in Table 1. The highest lipid content, about 20.0 percent, was observed in the belly flap area. In contrast, portions 8 and 9 in the tail area had the lowest lipid contents: 7.6 and 6.2 percent, respectively. The middle and dorsal portions of the fillets had relatively high lipid contents of 10.0-14.4 percent.
Munoz, Lipid distribution, Table 1
| Portion | Lipid Content, Coho Salmon | Lipid Content, Atlantic Salmon* |
|---|
Portion | Lipid Content, Coho Salmon | Lipid Content, Atlantic Salmon* |
|---|---|---|
| 1 | 20.0% | 18.2% |
| 2 | 20.2% | 18.5% |
| 3 | 16.4% | 5.6% |
| 4 | 15.1% | 6.1% |
| 5 | 11.2% | 3.3% |
| 6 | 14.0% | 14.4% |
| 7 | 10.1% | 10.1% |
| 8 | 7.6% | 4.3% |
| 9 | 6.8% | 2.4% |
In 2001, studies by P. Katikou and coauthors identified a different lipid deposition pattern in Atlantic salmon, in which the lowest lipid content occurred in the middle line of the fish (Table 1). However in a 3-kg coho salmon the pattern is different, since a lower content in the middle line does not exist. Nevertheless, the pattern in the tail and the intensity in the belly zone are equal in the two species. Finally, lipid content showed a negative correlation with muscle hardness.
(Editor’s Note: This article was originally published in the May/June 2007 print edition of the Global Aquaculture Advocate.)
Now that you've finished reading the article ...
… we hope you’ll consider supporting our mission to document the evolution of the global aquaculture industry and share our vast network of contributors’ expansive knowledge every week.
By becoming a Global Seafood Alliance member, you’re ensuring that all of the pre-competitive work we do through member benefits, resources and events can continue. Individual membership costs just $50 a year. GSA individual and corporate members receive complimentary access to a series of GOAL virtual events beginning in April. Join now.
Not a GSA member? Join us.
Authors
-
Susana Muñoz
Facultad de Ciencias Agronómicas
Universidad de Chile
Santa Rosa 11315
La Pintana, Santiago, Chile -
Ana M. Menéndez
Facultad de Ciencias Agronómicas
Universidad de Chile
Santa Rosa 11315
La Pintana, Santiago, Chile -
Nelson F. Díaz
Facultad de Ciencias Agronómicas
Universidad de Chile
Santa Rosa 11315
La Pintana, Santiago, Chile -
Louise Buttle
EWOS – Chile
Puerto Montt, Chile -
Javier González
EWOS – Chile
Puerto Montt, Chile
Related Posts

Aquafeeds
A look at phospholipids in aquafeeds
Phospholipids are the major constituents of cell membranes and are vital to the normal function of every cell and organ. The inclusion of phospholipids in aquafeeds ensures increased growth, better survival and stress resistance, and prevention of skeletal deformities of larval and juvenile stages of fish and shellfish species.

Aquafeeds
Alternative lipids spare fish oil in rainbow trout feeds
Alternative lipids have achieved varied success in ensuring adequate growth and fatty acid composition in fillets. The authors evaluated rainbow trout raised on diets containing fish oil or a blend of fish and standard or modified lipids varying in fatty acid composition.

Health & Welfare
Advances in fish hatchery management
Advances in fish hatchery management – particularly in the areas of brood management and induced spawning – have helped establish aquaculture for multiple species.

Health & Welfare
Alaska’s purple-hinge rock scallops considered for aquaculture development
Purple-hinge rock scallops are highly prized by local communities and harvested for subsistence in coastal Alaska. To evaluate the suitability of purple-hinge rock scallops for mariculture in Alaska, the authors conducted a four-year grow-out study.


