Temperature fluctuations affect biofilter performance in preliminary study
Spectrophotometer determined rate of ammonia decay over time
Recirculating aquaculture systems face the need to be more efficient than ever for production to increase with profit. This need and the demand for complementing fishing from natural habitats emphasize design improvements in existing systems.
A key element in recirculation systems is the biofilter, which is strategic to controlling ammonia concentrations below toxic levels and maintaining a cost-effective and profitable system. Biofilters therefore need to be optimized to increase production capacity and reduce the risk of mortality in varying environmental temperature conditions.
Temperature study
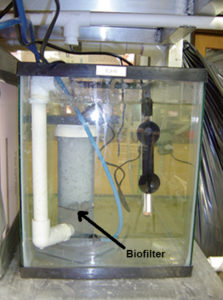
In a recent study, the authors set up a series of temperature-controlled tank systems to determine the effects of temperature variation on biofilter performance. The biofilters, which were custom designed to fit into the tanks as self-contained systems, were positioned independently and loaded with synthetic ammonia substrate feedstock. They were then exposed to temperature regimes of 20 ± 3 and 30 ± 30 degrees-C over a 72-hour period.
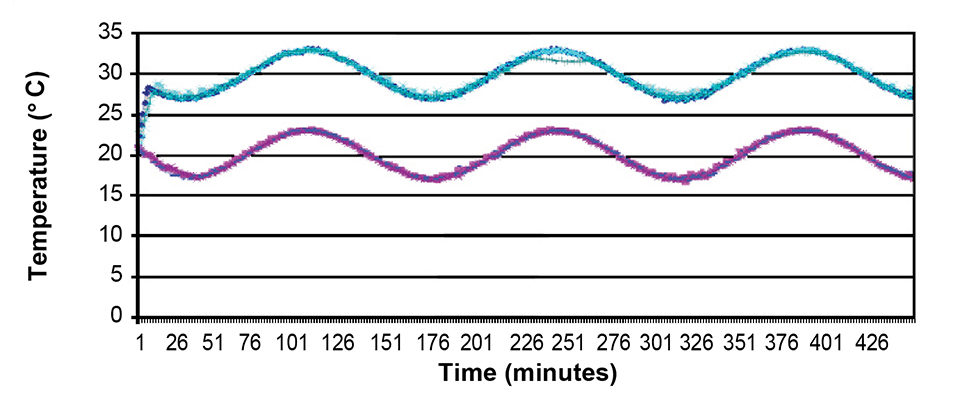
A computer-automated temperature-control system with independent 40-liter tanks was used for the experiment. Two triplicate batches of six tanks total were used to subject the biofilters to the two temperature regimes (Fig. 1). The biofilters were acclimated before sampling. The samples were analyzed using a spectrophotometer to determine the rate of ammonia decay over time at each temperature regime.
Results
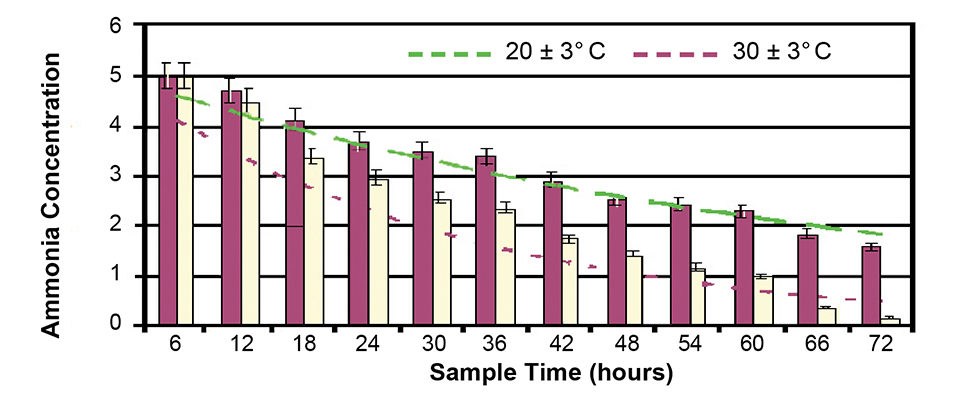
A reaction kinetics decay curve was plotted for the ammonia decay over time for both regimes (Fig. 2). At P < 0.05, the decay coefficients indicated the decay rate was higher at 30 ± 30 degrees-C. This may support further, in-depth study of temperature fluctuations in relation to biofiltration for future system designs.
(Editor’s Note: This article was originally published in the November/December 2008 print edition of the Global Aquaculture Advocate.)
Now that you've finished reading the article ...
… we hope you’ll consider supporting our mission to document the evolution of the global aquaculture industry and share our vast network of contributors’ expansive knowledge every week.
By becoming a Global Seafood Alliance member, you’re ensuring that all of the pre-competitive work we do through member benefits, resources and events can continue. Individual membership costs just $50 a year. GSA individual and corporate members receive complimentary access to a series of GOAL virtual events beginning in April. Join now.
Not a GSA member? Join us.
Authors
-

Department of Biological and Agricultural Engineering
Louisiana State University
Agriculture Center
Baton Rouge, Louisiana 70808 USA -
Department of Biological and Agricultural Engineering
Louisiana State University
Agriculture Center
Baton Rouge, Louisiana 70808 USA -
Department of Biological and Agricultural Engineering
Louisiana State University
Agriculture Center
Baton Rouge, Louisiana 70808 USA
Related Posts

Health & Welfare
Biofilter inoculation in recirculating aquaculture systems
Biological filters are essential parts of recirculating aquaculture systems that transform toxic fish compounds such as ammonium and nitrite into less-harmful nitrate. The authors tested the convenience and efficiency of three methods for the initial inoculation of aerobic biofilters.

Responsibility
Biofilter start-up problems? Just add sugar!
One way to jump start biofilter operation is by adding sugar, which can provide sufficient organic carbon to neutralize the ammonia-nitrogen produced.

Innovation & Investment
Estimating biofilter size for RAS systems
Controlling total ammonia-nitrogen (TAN) concentrations is the primary concern when sizing a biofilter for use in a recirculating aquaculture system. Sizing decisions are best based on previous experience with a given biofilter media in a specific biofilter configuration.

Responsibility
A look at unit processes in RAS systems
The ability to maintain adequate oxygen levels can be a limiting factor in carrying capacities for RAS. The amount of oxygen required is largely dictated by the feed rate and length of time waste solids remain within the systems.