Dietary vegetable oils modulate fatty acid metabolism and omega-3 fatty acid content of farmed tilapia

With the rising costs of fish oil (FO) and limited global supplies, the use of alternative lipid resources in aquafeeds, including tilapia feeds, has become more critical to enable the continued sustainability and scalability of the global aquaculture industry.
Terrestrial vegetable oils (VO) are viable alternatives because their production is more sustainable and cost-effective. However, unlike FO, which is rich in omega-3 long chain-polyunsaturated fatty acids (omega-3 LC-PUFA), VO are deficient in these essential fatty acids and high in other fatty acid classes.
In general, total or partial FO replacement by VO has been reported to have no deleterious effect on the growth performance of a variety of warmwater fish species as long as their essential fatty acid requirements are met. Nevertheless, the use of dietary VO decreases the health beneficial omega-3 LC-PUFA content of fish fillets and is considered a major challenge facing FO replacement in fish feeds.
Moreover, dietary fatty acids have been established to affect fatty acid metabolism. Therefore, a better fundamental understanding on how dietary lipid source modulates in vivo fatty acid metabolism is needed to better formulate fish feeds that can optimize not only growth performance but also maintaining the health benefits of eating seafood for the human consumer in regards to eicosapentaenoic acid (EPA) and docosahexaenoic acid (DHA) levels in farmed fish fillets.
As far as we know, there is currently no information comparing the fatty acid metabolism of red hybrid tilapia fed diets with lipids containing different major fatty acid classes. Therefore, the goal of this study was to examine the effects of individual VO with different fatty acid class profile as FO alternatives on growth performance, fish fatty acid composition and changes in the overall in vivo fatty acid metabolism in red hybrid tilapia.
These fundamental findings will serve as the basis for current and future fish nutritionists to develop newer concepts and methods for improving the efficiency of conversion of fish feed to food and the healthiness of fish products for human consumers. This article summarizes the original publication in Aquaculture, 2016, 465, 311-322.
Study setup
Five isonitrogenous and isolipidic semi-purified diets were used in the study. Different oils were used as the sole lipid source, i.e., FO (control diet), canola oil (CO) (high in monounsaturated fatty acids, MUFA), perilla oil (PeO) (high in omega-3 PUFA), sunflower oil (SFO) (high in omega-6 PUFA) and refined, bleached, deodorized palm olein (RBDPO) (high in saturated fatty acids, SFA and MUFA). Casein and gelatin were used as the main sources of protein in the diets, whereas dextrin was included as the carbohydrate source.
Chromic oxide was included in the diets at an inclusion rate of 0.5 percent as an inert marker for the determination of apparent nutrient digestibility. The diets were prepared according to standard laboratory procedures and dried diets were crumbled into pellets of an appropriate size and stored in airtight polyethylene bags at minus-20 degrees-C until required.
The experimental fish used were red hybrid tilapia (Oreochromis sp.) fingerlings from a local fish farm in Penang, Malaysia. Upon arrival at the university campus, the fish were held in a 1000-liter fiberglass tank and fed with pre-crushed, commercial tilapia starter feed. All fish were then acclimated to the experimental system for two weeks before the start of the feeding trial.
During the acclimation period, all fish were fed with a conditioning diet with protein and energy contents similar to the experimental diets, but containing no added lipid prior to commencing the feeding trial. Groups of 15 fish with an average initial weight of 8.9 ± 0.0 grams were randomly selected, weighed and stocked into a series of 15 aquaria. Each of the experimental diets was fed to randomly assigned, triplicate groups of fish. Sand filtered water flowed continuously into 95-liter aquaria at a flow-rate of 15 liters/hour. All aquaria were provided with continuous aeration. Fish were hand-fed twice a day to apparent satiation for 75 days with feed consumption recorded daily. Fish were batch-weighed weekly.
After six weeks into the feeding trial, fecal material (intact strands) were siphoned and collected with a fine mesh net. Fecal samples collected from each aquarium were pooled, freeze-dried and finely ground before analysis. At the end of the feeding trial, all fish were individually weighed and measured for total length. A sample of five fish per tank was randomly sampled, sacrificed and blood collected into heparinized tubes.
The sampled fish were dissected to remove various tissues for analysis and then skinned and filleted. Liver, viscera, gonads and intraperitoneal fat were excised and weighed for the determination of hepatosomatic index (HSI), viscerosomatic index (VSI), gonadosomatic index (GSI) and intraperitoneal fat index (IPF). Liver and fillet samples were pooled and kept frozen for subsequent chemical analysis. The remaining fish from each aquarium were culled and stored frozen at minus-20 degrees-C for subsequent whole-body proximate and fatty acid composition analysis.
For detailed procedures on the experimental setup – including chemical analysis, digestibility calculations, computation of the whole-body fatty acid balance and statistical analyses – refer to the original publication.
Results
Fish fed the FO diet showed the highest final weight while the lowest final weight was reported in fish fed the SFO diet, which was significantly lower (P<0.05). However, no significant differences (P>0.05) were observed in specific growth rate among all treatment groups. Fish fed the FO diet exhibited the lowest condition factor and significantly lower than that of PeO-fed or RBDPO-fed fish. No significant differences were noted in fish survival among the different dietary treatments. Likewise, no significant differences were detected for the IPF and hematocrit values among the dietary treatments.
Apparent digestibility coefficient of dry matter (ADCdry matter) ranged from 62.3 to 67.2 percent, with no significant difference observed among the treatments. Lipid digestibility was high and did not vary much numerically among treatments. Nevertheless, the FO diet had the lowest lipid digestibility (88.1 percent) which was significantly lower than the PeO, CO and SFO diets but not significantly different from the RBDPO diet.
The fillet fatty acid composition of fish reflected the fatty acid profile of the diets. Fish fed the FO or RBDPO diet recorded significantly higher SFA concentrations with 33.3 percent and 34.8 percent of total fatty acids, respectively, in comparison to fish fed the other diets ranging from 22.3 to 25.1 percent. The highest MUFA content was observed in fish fed the CO diet which was significantly higher than those fed the other four diets. The lowest concentration of PUFA (15.1 percent) was observed in fish fed the RBDPO diet and increased significantly to 47.8 percent for fish fed the PeO diet. Despite the four FO-deprived diet containing no PUFA longer than C18, LC-PUFA was detected in the muscle lipids of fish fed the VO diets and ranged from 7.3 percent-14.3 percent of total fatty acids.

The most abundant fatty acids in the initial and final whole-body fish lipids were 18:1n-9 and 16:0. Similar to the fatty acid profile in fillet lipids, total SFA was the significantly highest in fish fed the RBDPO diet. Fish fed the RBDPO or CO diets had significantly higher total MUFA, while the highest PUFA was shown for fish fed the SFO diet. Irrespective of the dietary lipid source, the n-3/n-6 ratios of the fish whole-body lipids were higher than the experimental diets. Fish fed the FO diet had the significantly highest content of EPA+DHA. Among the four VO-based diets, the EPA+DHA content of fish fed the CO or PeO diets were relatively higher than fish fed the SFO or RBDPO diets. With respect to arachidonic acid (ARA, 20:4n-6), fish fed the SFO or PeO diet had significantly the highest and lowest amount in fish whole-body lipids, respectively. A significantly higher amount of 20:2n-6 and 22:2n-6 was noted in fish fed the SFO diet, while a significantly higher content of 20:3n-3 was observed in fish fed the PeO diet.
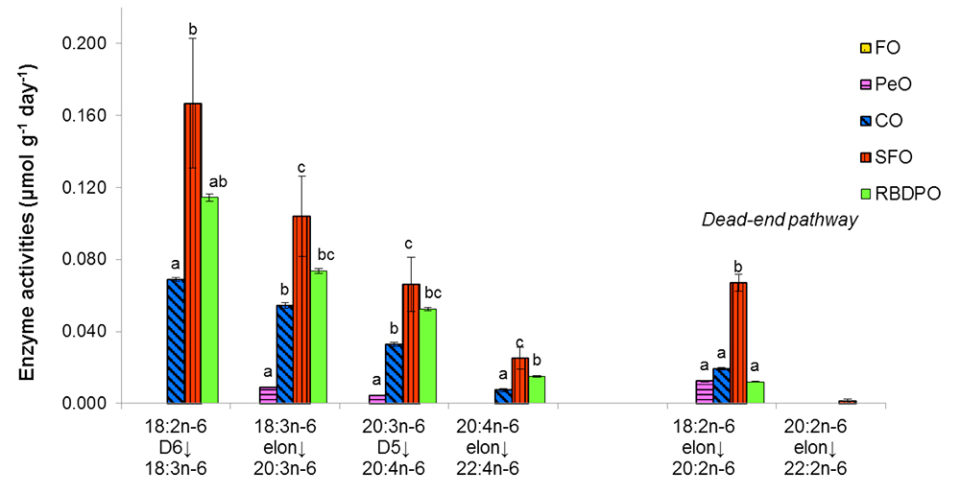
The FA neogenesis of fish was significantly different among the dietary treatments with the highest value observed in fish fed the PeO diet and the lowest value shown in fish fed the RBDPO diet. Elongation of SFA and MUFA was significantly higher in fish fed the PeO diet (1.915 µmol/g/day) compared to fish fed other diets. The highest oxidation of n-3 PUFA (2.779 µmol/g/day) was observed in fish fed the PeO diet; while the elongation, Δ-5 and Δ-6 desaturation on n-3 PUFA were significantly greatest in fish fed the CO diet. Fish fed the SFO diet had significantly higher elongation, oxidation and Δ-5 desaturation on n-6 PUFA than the other fish. No Δ-5, Δ-6 desaturase and elongase activity were detected on either n-3 or n-6 PUFA for fish fed the FO diet. With respect to total oxidation, fish fed the SFO or PeO diets showed significantly higher activity with 3.698 µmol g-1 day-1 and 3.452 µmol g-1 day-1, respectively, while the lowest activity was recorded in fish fed the RBDPO diet (0.749 µmol/g/day).
Significantly higher total elongation activity was observed in the fish fed the PeO diet (2.053 µmol/g/day) compared to those fed the other diets, with the activities ranging from 0.439 to 1.180 µmol/g/ day. However, fish fed the PeO diet had significantly lower total Δ-5 and Δ-6 desaturation than the other four VO-based diets, while fish fed the CO or SFO diets showed significantly lower total Δ-9 desaturase activities among the dietary treatments.
For 18:2n-6, no Δ-6 desaturation was recorded in fish fed the FO or PeO diet, while fish fed the SFO diet showed the highest activity. The significantly highest Δ-6 desaturase activity of 18:3n-3 was observed in fish fed the CO diet, while fish fed the SFO or RBDPO diet had the significantly lower activity compared to fish fed the PeO diet. A similar trend was also evident in the Δ-6 desaturation of 24:5n-3 and Δ-5 desaturation of 20:4n-3. With respect to the Δ-5 desaturation on 20:3n-6, fish fed the SFO diet had the highest activity, followed by fish fed the RBDPO, CO and PeO diets.
With regard to 18:1n-9, no oxidation was observed in fish fed the FO or PeO diets, while fish fed the CO diet had significantly higher β-oxidation than fish fed the SFO or RBDPO diet. The highest β-oxidation of 18:3n-3 and 18:2n-6 were observed in fish fed the PeO and SFO diets, respectively. The β-oxidation on EPA and DHA was observed only in fish fed the FO diet.

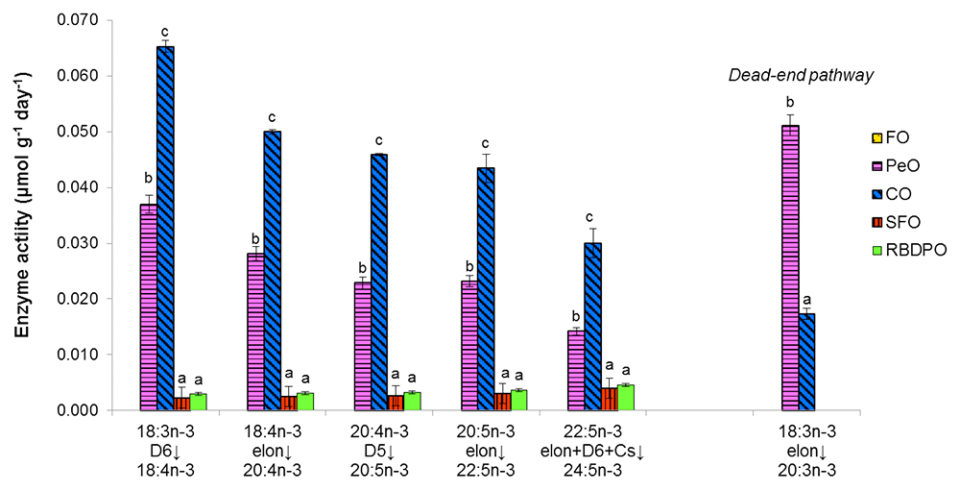
Along the biosynthetic pathway of n-3 PUFA, fish fed the FO diet showed no activity for all the involved enzymes. Among the VO treatments, significant differences were detected on Δ-6 desaturation of 18:3n-3 where the highest activities were found in fish fed the CO diet, followed by fish fed the PeO diet; while lower activities were detected in fish fed the RBDPO or SFO diets. For all the subsequent elongation, Δ-5 and Δ-6 desaturation, a similar trend among the dietary treatments was observed.

Fish fed the SFO diet showed the highest enzyme activities along the biosynthetic pathway from 18:2n-6 to 22:4n-6, followed by the fish fed the RBDPO and CO diets. Fish fed the PeO diet showed minimal activities on the elongation of 18:3n-6 and Δ-5 desaturation of 20:3n-6. No Δ-6 desaturation on 18:3n-3 and elongation on ARA was observed in fish fed the PeO or FO diet. On the dead-end pathway of n-6 PUFA, fish fed the SFO-based diet has the highest elongation of 18:3n-6 and was significantly higher than those fed the other VO diets, while no activity was shown by the fish fed the FO diet. The elongation on 20:2n-6 was minimal for all the dietary treatments. Similar to the n-3 PUFA pathway, the enzyme activities were decreasing gradually.

Perspectives
With the exception of sunflower oil, results showed that total FO replacement by various VO did not compromise tilapia growth performance. However, dietary VO influenced the fatty acid composition of tilapia fillet and whole-body lipids as well as regulating the overall fatty acid metabolism in tilapia. The availability of dietary C18 PUFA precursors and enzyme products dominated the fatty acid desaturation, elongation and neogenesis in tilapia, while total Δ-5 and Δ-6 desaturase activities were exclusively triggered by the VO diets.
Tilapia fed the VO diets, which contained no PUFA longer than C18, recorded significant amounts of both n-6 and n-3 LC-PUFA in their tissue lipids. Dietary CO increased Δ-6 desaturation of 18:3n-3 to the greatest extent despite the dietary 18:3n-3 content being comparatively lower than dietary PeO. Beta-oxidation of 18:3n-3 was observed to be highest in fish fed the PeO diet, indicating that the 18:3n-3 content in the PeO diet exceeded the optimum substrate level for Δ-6 desaturase. Among all the VO, CO appears to be the most suitable alternative oil source as it led to higher desaturation (Δ-5 and Δ-6) and elongation on n-3 PUFA, which consequently resulted in higher EPA + DHA content in fish tissues. However, endogenous LC-PUFA synthesis induced by the VO diets was insufficient to rival the n-3 LC-PUFA content of fish fed the FO diet.
It was also observed that β-oxidation of 18:3n-3 and 18:2n-6 was regulated by tissue n-3/n-6 PUFA ratio and proportional to their dietary level. This study provided the first comprehensive evidence of the significant impact of dietary oils with different fatty acid class profile on the in vivo fatty acid metabolism of tilapia.
Now that you've finished reading the article ...
… we hope you’ll consider supporting our mission to document the evolution of the global aquaculture industry and share our vast network of contributors’ expansive knowledge every week.
By becoming a Global Seafood Alliance member, you’re ensuring that all of the pre-competitive work we do through member benefits, resources and events can continue. Individual membership costs just $50 a year. GSA individual and corporate members receive complimentary access to a series of GOAL virtual events beginning in April. Join now.
Not a GSA member? Join us.
Authors
-

Wing-Keong Ng, Ph.D.
Professor
Fish Nutrition Laboratory
School of Biological Sciences
Universiti Sains Malaysia
Penang 11800, Malaysia -

Chaiw-Yee Teoh, Ph.D.
Fish Nutrition Laboratory
School of Biological Sciences
Universiti Sains Malaysia
Penang 11800, Malaysia
Tagged With
Related Posts

Aquafeeds
A look at phospholipids in aquafeeds
Phospholipids are the major constituents of cell membranes and are vital to the normal function of every cell and organ. The inclusion of phospholipids in aquafeeds ensures increased growth, better survival and stress resistance, and prevention of skeletal deformities of larval and juvenile stages of fish and shellfish species.

Aquafeeds
A look at the SME controlled extrusion process
A study was conducted using a Twin-Screw Extruder equipped with Specific Mechanical Energy (SME) and Density Control valves, to determine the effect of SME on the water stability of shrimp feeds. Further research is needed to evaluate the performance.

Aquafeeds
Alternative feed ingredient universe to convene at F3 meeting
What started out as a simple yet ambitious contest to drive innovation in the aquafeed sector has evolved into a fully global competition – and collaboration – amongst ingredient suppliers and feed manufacturers.

Aquafeeds
Aquaculture Exchange: Lukas Manomaitis, USSEC
The U.S. Soybean Export Council is a huge supporter of aquaculture growth globally, as so many aquafeed formulators rely on U.S. soy to create nutritious diets. The Southeast Asia senior technical advisor for USSEC’s aquaculture program talks about this symbiotic partnership.

