Predicting minimum depuration times for norovirus

Norovirus (NoV) is one of the dominant causes of global foodborne illness. In 2011 in the United States of America alone, an estimated 58 percent of 9.4 million cases of food-borne illness were attributed to norovirus. A global increased occurrence of NoV has been reported, with children under 5 years old in developing countries deemed to be particularly vulnerable to the effects of acute gastroenteritis. One pathway identified for norovirus to pass into the human population is the consumption of bivalve shellfish.
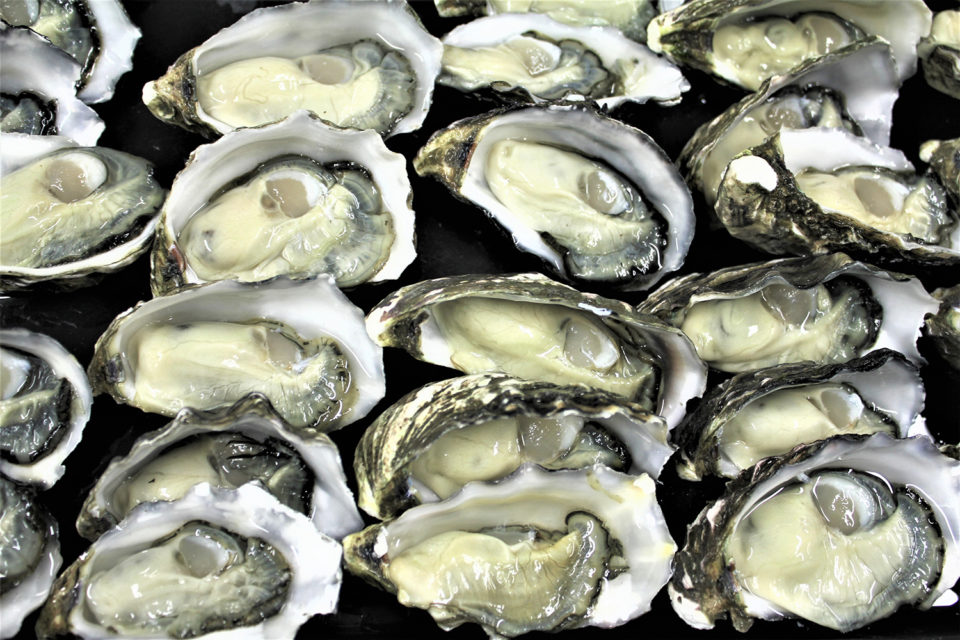
Shellfish filter-feed nutrients from their surrounding waters which, in addition to feeding, can concentrate contaminants and infectious agents often associated with faecal contamination into their digestive system. The potential exists for transmission of such agents into the human population if the shellfish are consumed while they still contain such pathogens. This is of special concern when shellfish are eaten raw, which is commonly the case for various oyster species.
Depuration is the most common alternative, a process which re-submerges harvested shellfish in tanks containing clean water, where they remain for a period of time sufficient for the animals to excrete any microbiological contaminants they may contain. At present, NoV levels within shellfish are reduced only by methods put in place to mitigate other contaminants, despite posing a potential risk to consumer health. Although several countries have conducted monitoring for viral contamination, thus far no producer countries have implemented legislative standards.
Since depuration can incur significant costs to the shellfish industry, minimizing any costs while at the same time minimizing NoV levels in shellfish would be beneficial to both the industry and the consumer. Thus an increased understanding of the dynamics of NoV loads during depuration is crucial in order to determine the time required to reduce NoV to safe levels whilst minimizing costs.
This article – adapted and summarized from the original publication – reports on modeling the depuration process to determine how NoV (as well as other water-borne pathogens) levels in shellfish batches change over time spent in depuration. This is based on the initial pathogen values, and the way in which the pathogen loads evolve over time is also incorporated into the model.
We would like to thank Drs. Rachel Hartnell and Anna Neish of the Centre for Environment, Fisheries & Aquaculture Science in Weymouth for their guidance and input.

NoV depuration model
A combination of data from the literature was used to derive parameters for NoV to use with the model. Its development included modeling pre- and post-depuration pathogen distributions; minimum depuration times; depuration decay rate parameterization; distribution dynamics during depuration; and other tasks.
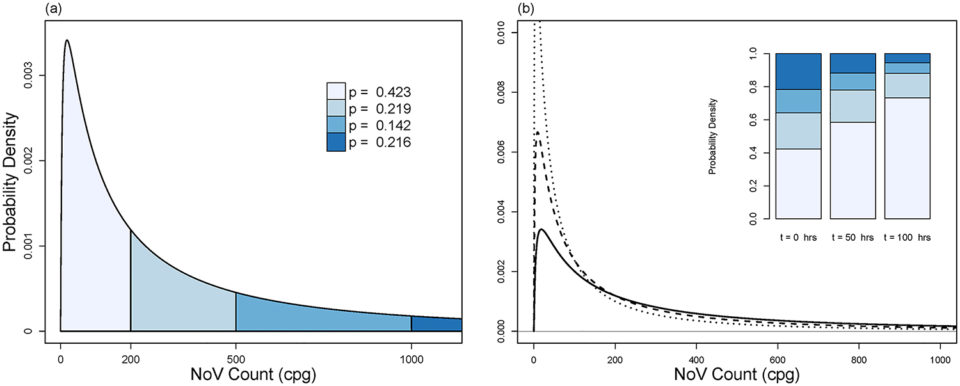
In particular, this study considers the following questions to construct and test the model: (i) What is the distribution of NoV loads at the beginning of the depuration and how does this change over time? (ii) What is the probability that the NoV load in a randomly sampled shellfish exceeds a defined threshold value? (iii) What duration of depuration is required to reduce the potential risk of a shellfish containing NoV loads above such a threshold being sold for consumption? (iv) Does the model apply to other water-borne pathogens, such as the bacterium Escherichia coli? (v) Do depuration times modeled for E. coli meet the minimum 42 hours depuration criterion?
For detailed information on model development, consult the original publication.
Results and discussion
NoV is a significant cause of gastroenteritis globally, and the consumption of oysters is linked to outbreaks. For products placed live on the market, depuration is the principle means employed to reduce levels of potentially harmful agents in shellfish. Though the minimum depuration times for faecal indicator organisms such as coliform bacteria are well established, little data is currently available to inform these times for NoV. Results of our study provide a mathematical framework that could be used to help determine the minimum depuration times required to reduce NoV levels to below a desired threshold.
This model is based on the well documented assumptions that NoV is log-normally distributed throughout a population of oysters and that pathogen load decay during depuration is exponential. The model requires the input of four parameters: (i) the initial average NoV load, (ii) the depuration efficacy, (iii) the desired assurance level and (iv) the required NoV threshold. Based on these inputs the model provides an estimate of the minimum depuration time required to reduce norovirus levels below the desired threshold. This, in conjunction with the other parameters, can also be used to determine the probability of a batch of oysters testing below the detection threshold after depuration.
A protocol for determining minimum depuration times using the model is as follows:
- Measure the initial mean pathogen load of oyster batch’s harvest site.
- Determine characteristic efficacy of overall depuration process.
- Fix value of NoV load threshold, Ψ;
- Select NoV assurance level, φ;
- Apply these parameter values to the model to obtain recommended depuration period.
Steps 1 through 3 are anticipated to be assessed or fixed by public health authorities. The NoV assurance level parameter may not be fixed (e.g. by legislation); however, applying larger values of this parameter in the model would provide increased confidence to both depurators and consumers, as this would require a greater proportion of the population’s pathogen load to be less than NoV threshold, and so would extend predicted minimum depuration times (MDTs). This would ensure that oysters passing into the supply chain would have a diminished probability of containing significant NoV levels.

The initial NoV load is determined using the international standard for quantification of NoV in foods prior to depuration. This test provides a NoV load for a pooled sample of 10 oysters, assumed to be the arithmetic mean of the loads in the individual oysters within the population of 10. However, this provides no information on variability within the population, which is required in the calculation of depuration times, but a worst-case level of variability can be determined in the absence of this data. This worst-case variability increases with the desired assurance level, as does the depuration time required.
Further work would be required to accommodate terms describing pathogen replication within shellfish during depuration and are not included as NoV has previously been reported as being only carried, and not replicated, whilst within shellfish. As real data becomes available for variability in NoV between oysters, this can be substituted for the worst-case variance, which will result in a reduction in the predicted depuration times. Little data is currently available regarding the depuration efficacy of different systems for the removal of NoV.
The assurance level (set by the regulator) determines the desired proportion of oysters in the population with NoV levels below the set threshold after depuration. This is important as, in addition to providing a confidence level associated with the safety of a batch depurated oysters, it is also directly linked to the probability that a sample of 10 oysters will return a value below the threshold after depuration. Though increasing the assurance level also increases the required depuration time, it will also reduce the probability that a batch of oysters will fail testing, thus allowing risk managers to evaluate the tradeoffs between depuration times and an acceptable failure rate.
Perspectives
In conclusion, depuration is one of the tools through which shellfish industries aim to reduce NoV to an acceptable level. This study arose from a desire to provide a useful framework to help industry and regulators understand the relationship between possible future, desired NoV levels and required depuration times. In doing so this also provides a tool with which to determine by how much depuration efficacies may need to improve to reduce depuration times to levels deemed economically and logistically feasible by industry.
Having the ability to determine the depuration times required to bring NoV loads to below threshold levels should be provide a useful tool to both producers and risk managers.
Now that you've finished reading the article ...
… we hope you’ll consider supporting our mission to document the evolution of the global aquaculture industry and share our vast network of contributors’ expansive knowledge every week.
By becoming a Global Seafood Alliance member, you’re ensuring that all of the pre-competitive work we do through member benefits, resources and events can continue. Individual membership costs just $50 a year. GSA individual and corporate members receive complimentary access to a series of GOAL virtual events beginning in April. Join now.
Not a GSA member? Join us.
Authors
-
Paul McMenemy, Ph.D.
Computing Science and Mathematics
Faculty of Natural Sciences
University of Stirling, United Kingdom
Epidemiology Team, CEFAS, Weymouth, United Kingdom[107,117,46,99,97,46,114,105,116,115,64,121,109,101,110,101,109,99,109,46,108,117,97,112]
-
Adam Kleczkowski, Ph.D.
Computing Science and Mathematics
Faculty of Natural Sciences
University of Stirling, United Kingdom -
David N. Lees, Ph.D.
Food Safety Group, CEFAS
Weymouth, United Kingdom -
James Lowther, Ph.D.
Food Safety Group, CEFAS
Weymouth, United Kingdom -
Nick Taylor, Ph.D.
Epidemiology Team, CEFAS
Weymouth, United Kingdom
Tagged With
Related Posts

Health & Welfare
A comprehensive look at the Proficiency Test for farmed shrimp
The University of Arizona Aquaculture Pathology Laboratory has carried out the Proficiency Test (PT) since 2005, with 300-plus diagnostic laboratories participating while improving their capabilities in the diagnosis of several shrimp pathogens.

Intelligence
As ocean temperatures rise, so too will vibrio outbreaks
A study using a half-century of data has linked climate change and warming sea temperatures with an increase in illnesses from the common vibrio bacteria. Shellfish growers, fighting a particularly virulent strain of Vibrio parahaemolyticus, are changing their harvest protocols.

Intelligence
Behold the nutritious oyster
Oysters provide important, natural filtration of water and are an important component of many healthy coastal ecosystems because their active filtering can help improve and maintain water quality. For many coastal communities, oysters are an important food resource and excellent sources of protein and amino acids, zinc, selenium, iron and B-vitamins.

Responsibility
Can oyster farms protect wild oysters from disease?
Research results suggest that oyster farming can enhance wild oyster populations if oysters are harvested before spreading disease.


