Globally, seafood and fish products are the third major source of humans’ dietary protein

Food insecurity and hunger are significant problems facing the world’s disadvantaged and poor, controlling their socioeconomic development and health. The latest estimates from the Food and Agriculture Organization of the United Nations (FAO) indicate that more than 795 million people had chronically inadequate levels of dietary energy intake from 2014 to 2016, and that there were widespread micronutrient deficiencies.
This article is adapted and summarized from the original publication (Reviews in Fisheries Science & Aquaculture, DOI:10.1080/23308249.2017.1328659), which used data from the latest FAO food balance sheets (FAO 2016) to compare the role played by fish and fishery products from wild capture fisheries or aquaculture in the diet of the world’s poorest and richest nations.
Seafood relevance
Fish and seafood products represent an important component of the human diet, providing about 3.1 billion people with almost 20 percent of their average daily animal protein intake and supplying the only readily available dietary source of long-chain omega-3 polyunsaturated fatty acids for direct consumption.
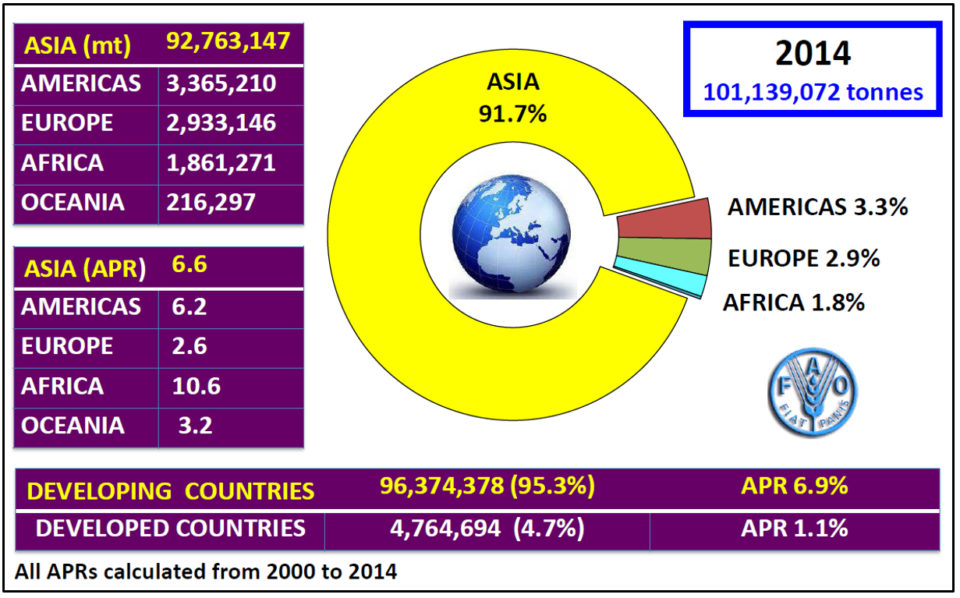
According to FAO, aquaculture is the fastest growing food-producing segment globally, growing at an average annual rate of 8 percent per year over the past 30 years, and reaching a new high of 101.1 million metric tons (MT) in 2014 (surpassing total wild-capture fisheries landings). Farmed seafood production includes 49.9 million MT of finfish (49.3 percent total), 27.3 million MT of aquatic plants (27.0 percent), 16.2 million MT of molluscs (16.0 percent), 6.9 million MT of crustaceans (6.8 percent), 0.4 million MT of miscellaneous invertebrate aquatic animals (0.4 percent), and 0.48 million MT of amphibians and reptiles (0.5 percent).

National food balance sheets and seafood
At a global and regional level, per capita fish supply was 19.7 kg globally, with lowest levels in the Latin America-Caribbean and African regions at 10.0 kg and 9.9 kg, respectively. In comparison, per capita fish supply was highest within most small island states and Oceania at 24.8 kg, followed by the Asian region at 23.1 kg, Europe at 21.9 kg and North America at 21.7 kg. As expected, land-locked countries had the lowest per capita fish supply of only 6.5 kg, with fish contributing 9.1 percent of total animal protein supply.
Similarly, low-income countries had the lowest per capita fish supply of 7.9 kg (mean of 31 countries), followed by lower-middle income countries at 16.5 kg (mean of 51 countries), upper-middle income countries at 18.7 kg (mean of 55 countries) and high-income countries at 30.3 kg (mean 69 countries).
However, regarding the contribution of fish to total animal protein supply, the highest reported was for low-income countries at 21.6 percent, followed by lower-middle income countries at 20.7 percent, high-income countries at 15.1 percent, and upper-middle income countries at 13.4 percent.

Role of fish and other food products in total food supply
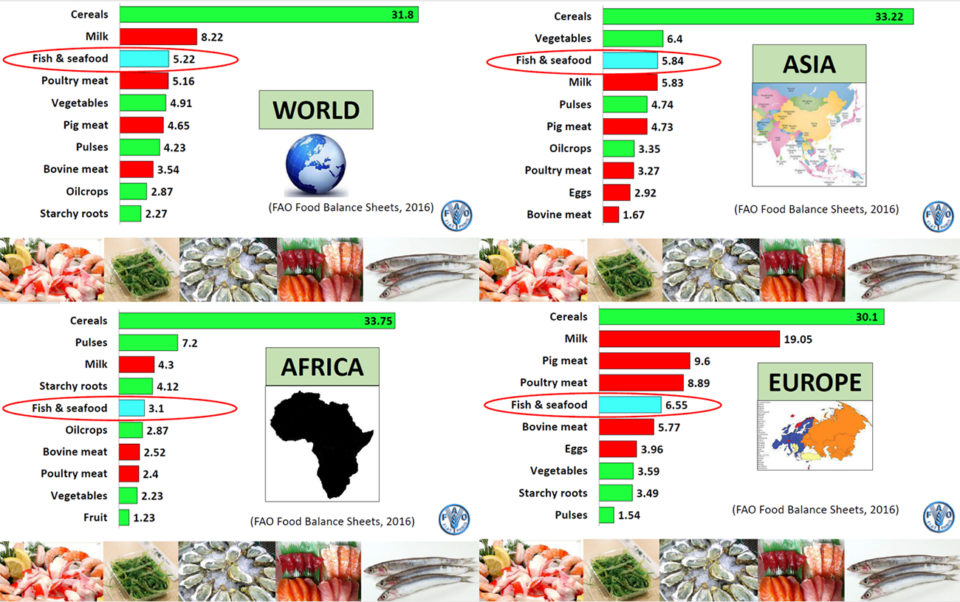
Globally, seafood and fish products are the third major source of dietary protein consumed by humans after cereals and milk, comprising 6.4 percent of total protein supply (19.8 percent of total animal protein supply), 1.4 percent of total fat supply, and 1.2 percent of total calorie supply. But by regions there are several notable differences.
Asian region
Overall, fish and seafood products were the third major source of dietary protein consumed after cereals and vegetables, representing 7.5 percent of total protein supply (21.9 percent of the total animal protein supply), 1.7 percent of total fat supply, and 1.3 percent of total calories.
In China, fish and seafood products were the fourth major source of dietary protein consumed after cereals, vegetables, and pig meat, representing 8.5 percent of total protein supply (21.2 percent of total animal protein supply), 1.5 percent of total fat supply, and 1.6 percent of total calorie supply. In India, fish and seafood products were the fifth major source of dietary protein consumed after cereals, milk, pulses and vegetables, representing 2.5 percent of total protein supply (12.8 percent of total animal protein supply), 0.6 percent of total fat supply, and 0.4 percent of total calorie supply.
In Indonesia, fish and seafood products were the second major source of dietary protein consumed after cereals, representing 15.0 percent of total protein supply (52.7 percent of total animal protein supply), 3.3 percent of total fat supply and 2.1 percent of total calorie supply. And in Japan, fish and seafood products were the second major source of dietary protein consumed after cereals, representing 19.9 percent of total protein supply (36.1 percent of total animal protein supply), 6.8 percent of total fat supply and 4.8 percent of total calorie supply.
African region
Overall, seafood and fish products were the fifth major source of dietary protein consumed after cereals, pulses, milk and starchy roots, representing 4.5 percent of total protein supply (19.3 percent of total animal protein supply), 1.3 percent of total fat supply and 0.76 percent of total calorie supply.
In Malawi, fish and seafood products were the fifth major source of dietary protein consumed after cereals, pulses, starchy roots and oil crops, representing 3.4 percent of total protein supply (28.0 percent of total animal protein supply), 01.2 percent of total fat supply and 0.6 percent of total calorie supply. In Uganda, fish and seafood products were the third major source of dietary protein after cereals and pulses, representing 7.1 percent of total protein supply (30.1 percent of total animal protein supply), 1.8 percent of total fat supply and 1.1 percent of total calorie supply.
In Nigeria, fish and seafood products were the fifth major source of dietary protein consumed after cereals, pulses, starchy roots and oil crops, representing 6.6 percent of total protein supply (42.5 percent of total animal protein supply), 1.5 percent of total fat supply, and 1.0 percent of total calorie supply. And in Egypt, fish and seafood products were the second major source of dietary protein after cereals, representing 6.1 percent of total protein supply (24.0 percent of total animal protein supply), 2.3 percent of total fat supply and 1.1 percent of total calories.

European region
Fish and seafood products were the fifth major source of dietary protein consumed after cereals, milk, pig meat and poultry meat, representing 6.4 percent of total protein supply (11.3 percent of total animal protein supply), 1.6 percent of total fat supply and 1.4 percent of total calories supplied.
South American region
Fish and seafood products were the seventh major source of dietary protein consumed after cereals, bovine meat, poultry meat, milk, pulses and pig meat, representing 3.3 percent of total protein supply (6.0 percent of total animal protein supply), 0.6 percent of total fat supply and 0.6 percent of total calorie supply.
North American region (USA, Canada and Mexico)
Fish and seafood products were the sixth major source of dietary protein consumed after cereals, milk, poultry meat, bovine meat, and pig meat, representing 4.7 percent of total protein supply (7.5 percent of total animal protein supply), 0.8 percent of total fat supply and 1.0 percent of total calories.
Oceania region
Fish and seafood products were the fifth major source of dietary protein consumed after cereals, milk, poultry meat and bovine meat, representing 6.7 percent of total protein supply (10.2 percent of total animal protein supply), 1.2 percent of total fat supply, and 1.4 percent of total calories.
Low-income Food Deficit Countries (LIFDCs)
Overall, fish and seafood products were the sixth major source of dietary protein consumed after cereals, milk, pulses, vegetables and starchy roots, representing 3.5 percent of total protein supply (17.1 percent of total animal protein supply), 0.9 percent of total fat supply, and 0.5 percent of total calorie supply.
The per capita supply of terrestrial animal meat products was lowest in low-income and lower-middle income countries (India 3.69 kg, LIFDCs 7.96 kg, Nigeria 9.2 kg, Malawi 11.25 kg, Indonesia 13.55 kg, Africa 19.01 kg) and highest within high-income countries (USA 115.13 kg, North America 112.72 kg, Oceania 108.49 kg).
The total dietary energy supply was generally lowest in low-income and lower-middle income countries and highest in high-income economies (with a few noticeable exceptions such as Japan), including the United States, North America, Europe and Oceania).
Plant and vegetable produce contribute over 90 percent of the total dietary energy supply within most low income and lower-income countries, including Nigeria at 96.2 percent, Malawi at 94.1 percent, Indonesia at 93.4 percent, Africa at 91.8 percent, LIFDCs at 91.5 percent, Uganda at 91.4 percent, Egypt at 90.6 percent and India at 90.4 percent.
Sugars and sweeteners contribute over 10 percent of total dietary energy supply in most high-income countries and regions, including the United States at 16.3 percent, North America at 15.9 percent, Oceania at 12.4 percent, South America at 13.5 percent, Europe at 11.5 percent and Japan at 9.3 percent.

Perspectives
The data included and analyzed in this study distinctly show that seafood – whether from aquaculture or wild capture fisheries – has an important role as a source of dietary protein and other essential nutrients. Globally, seafood and fish products are the third major source of dietary protein consumed by humans after cereals and milk, contributing 6.5 percent of total protein supply or 16.4 percent of total supply of animal protein.
Still, it is evident that during the last two decades global seafood supply from capture fisheries has not kept pace with human population growth, making aquaculture the only real alternative to increase global production and availability in the long term. Overall, the data we used clearly show that the “more you earn, the relatively less you spend on food.”
Additionally, it is also evident that seafood and fish have a more relevant role in the nutrition of people in low-income countries within the African region (mostly from fisheries) and within the Asian region (mostly from aquaculture). However, with increasing income, there has also been a major shift away from the traditional, high-fiber staple foods to a Western style diet with more consumption of refined and processed refined foods like dairy products, eggs, animal meats, refined sugars and vegetable oils.
The excessive consumption of these products, from a health perspective, combined with a more sedentary lifestyle can clearly have a negative effect on human health including increased risk of stroke, coronary heart disease and diabetes. However, a high consumption of seafood and fish products combined with moderate meat products consumption – as is the case in countries like Japan – together with a restricted calorie intake can have beneficial effects on longevity and health.
References available from first author.
Authors
-

Albert G.J. Tacon, Ph.D.
Aquatic Farms, Ltd.
49-139 Kamehameha Highway
Kaneohe, Hawaii 96744 USA -
Marc Metian, Ph.D.
Radioecology Laboratory, International Atomic Energy Agency – Environment Laboratories
Monaco, Principality of Monaco
Related Posts

Aquafeeds
Biosecurity protocols needed for shrimp feeds, feeding practices
Shrimp aquafeeds – live, fresh or formulated – should not be an entry point of potential pathogens to the shrimp and/or to their culture systems.

Innovation & Investment
Aquaculture America 2017: Communication key to the future
This year’s Aquaculture America in San Antonio, Texas, provided significant learning and networking opportunities. It successfully brought together 14 U.S. aquaculture organizations and more than 1,600 participants from Europe, Asia, Africa and Australia.

Responsibility
We can meet our planet’s protein needs with aquaculture
Science tells us that domesticated livestock and fowl cannot begin to address our world’s near-term protein needs, and that farming fish is our best option. Getting more public support is critical to the success of aquaculture and our planet.

Responsibility
Can sustainable mariculture match agriculture’s output?
Global, sustainable mariculture production, developed on a massive, sustainable scale and using just a small fraction of the world’s oceanic areas, could eventually match the output of land-based agriculture production. Scale and international law considerations require the involvement of many stakeholders, including national governments and international organizations.


