IFFO offers updated FIFO calculation method

One of the most persistent debates in aquaculture is on the use of fishmeal and oil in fish feed and, above all, the quantity of wild-caught fish required to produce farmed fish. This debate has reached its peak in the area of salmon farming. Many different figures have been presented regarding the quantity of raw material required.
Unequal growth
In the last 50 years, global fishmeal and oil production have oscillated between 4.0 and 7.0 million metric tons (MT), and between 0.9 and 1.5 million MT, respectively. In 2010, the El Niño phenomenon caused one of the lowest productions of fishmeal in the last 40 years. However, the production has been showing a downward trend since 2003, due to an increase in the volume of raw material destined for direct human consumption and the precautionary approach currently taken by fisheries in various countries.
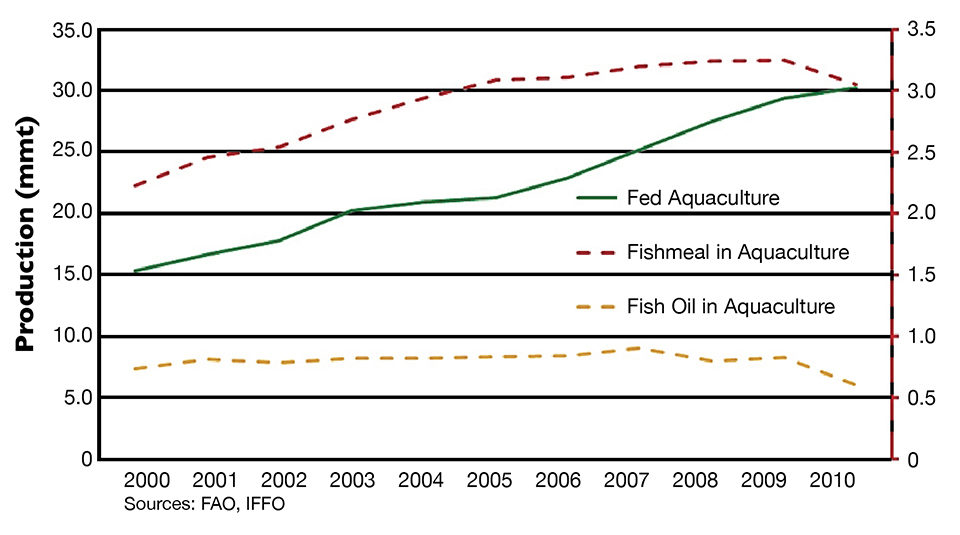
The opposite is true with aquaculture, which continues growing at an even faster pace than the use of marine-based ingredients in feed. The production of aquaculture grew by 97 percent in the last decade (Fig. 1), while the use of marine-based ingredients grew by 23 percent.

The use of fishmeal in aquaculture has increased by approximately 800,000 MT over the last 10 years, while that of fish oil has remained almost stable, even showing a reduction of approximately 100,000 MT in the last few years. This reduction may be due to higher efficiency in the composition of feeds, as well as replacement with other ingredients, such as vegetable-based oils and proteins.
Unequal reporting
Nevertheless, scientists, environmental non-governmental organizations and even celebrities have expressed concerns about feeding fish to fish and the dependency of aquaculture on ingredients of marine origin. These concerns have pointed out various arguments with respect to the figures used to express how many kilograms of wild fish are required to produce 1 kg of farmed fish – expressed as a fish in:fish out (FIFO) ratio.
Certain arguments have gone to the extreme, particularly with salmon, to demonstrate FIFO ratios as high as 10:1. Aquaculture nutritionists Dr. Albert Tacon and Dr. Marc Metian carried out a study in 2008 that examined the outlook for marine ingredient use in the aquafeed industry and estimated a 2010 FIFO ratio of 3:1 for salmon.
Calculation methods
Tacon and Metian established theoretical FIFO averages for the main groups of farmed species. But if we take, for example, their numbers for 2010 and apply the established global FIFO figures, discrepancies with the quantities of raw material used appear. Table 1 is composed of all the groups and values for the year 2010 mentioned.
Jackson, Fish in:fish out ratios for select species, Table 1
| Species Group | FIFO | Production (mmt) | Raw Material (mmt) |
|---|
Species Group | FIFO | Production (mmt) | Raw Material (mmt) |
|---|---|---|---|
| Salmonids (salmon and trout) | 2.5 | 2.54 | 6.4 |
| Eels | 2.7 | 0.26 | 0.7 |
| Marine fish | 1.6 | 2.55 | 4.1 |
| Crustaceans (marine and freshwater) | 0.7 | 5.48 | 3.8 |
| Tilapia | 0.2 | 3.00 | 0.6 |
| Other freshwater fish | 0.3 | 4.05 | 1.2 |
| Fed carp | 0.1 | 12.17 | 1.2 |
| Sum of each group | 18.0 | ||
| Total | 0.5 | 30.05 | 15.0 |
To obtain the amount of raw material used, multiply the production of the species by the FIFO ratio. In the case of salmonids, 2.54 x 2.50 = 6.40. Adding the quantities of raw material obtained in each group yields a total figure of 18 million MT. However, if we multiply the total production of all the groups by the mean total FIFO figure – 30.05 x 0.50 = 15.00 – we see a value of 15 million MT. This differs from the first result by 3 million MT of raw material, which indicates errors in the calculation or that figures have been counted twice. Looking at the calculation method, a quantity of fishmeal is considered lost as waste or simply disappears.
According to Tacon and Metian, the proportions of fishmeal and oil obtained from pelagic fishing are 22.5 and 5.0 percent, respectively. This means that 1,000 kg of fish are converted into 225 kg of fishmeal and 50 kg of fish oil. Added to this, fishmeal contains approximately 8 percent oil, which is added to the 50 kg already mentioned.
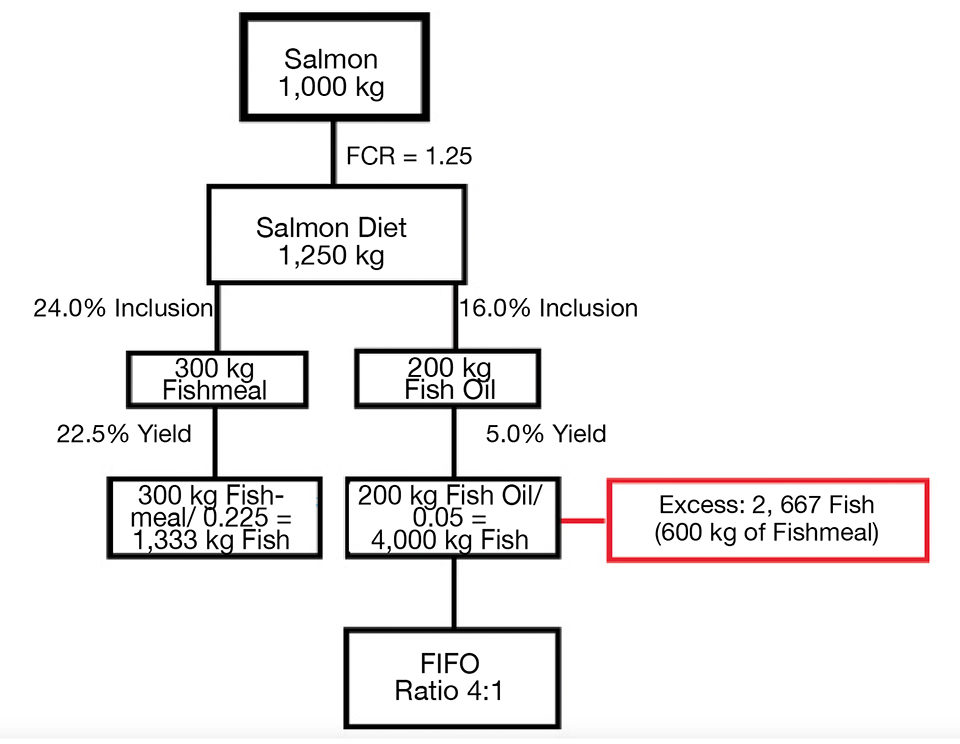
Now suppose we want to produce 1,000 kg of salmon, which under ideal conditions without disease and with low mortality and extremely high feed quality have a feed-conversion ratio (FCR) of 1.25 (Fig. 2). This quantity of salmon would require 1,250 kg of feed (1,000 x 1.25 = 1,250 kg). The salmon feed contains 24 percent fishmeal and 16 percent fish oil, as well as the 8 percent oil content contained in the meal.

To obtain 1,250 kg of feed would require 300 kg of fishmeal and 200 kg of fish oil (1,250 x 0.24 = 300 kg, 1,250 x 0.16 = 200 kg). These 300 kg of fishmeal come from 1,333 kg of wild-caught fish (300 kg/0.225 = 1,333 kg), and the 200 kg of additional oil come from 4,000 kg of wild-caught fish (200 kg/0.05 = 4,000 kg). Notice that all the fish oil is used to produce salmon feed, but in the case of the fishmeal, there are 600 kg (equivalent to 2,667 kg of wild-caught fish) left over. In these calculations, this leftover fishmeal is simply thrown away or wasted.
Base measurements
The World Wildlife Fund aquaculture dialogues have suggested carrying out two different calculations, one for fishmeal and another for fish oil. EWOS, one of the worlds largest suppliers of feed for farmed fish, has a different calculation method and argues that these methods should not be applied to the quantity of whole fish used to produce a given quantity of farmed fish, but should rather focus on the quantity of protein from captured wild fish required to produce protein for farmed fish and the quantity of fish oil from wild fish required to produce fish oil for farmed fish.
The problem with these methods is that they give different results and cause confusion. They also don’t give a response to the main question: How many tons of wild fish are required to produce 1 MT of farmed fish?
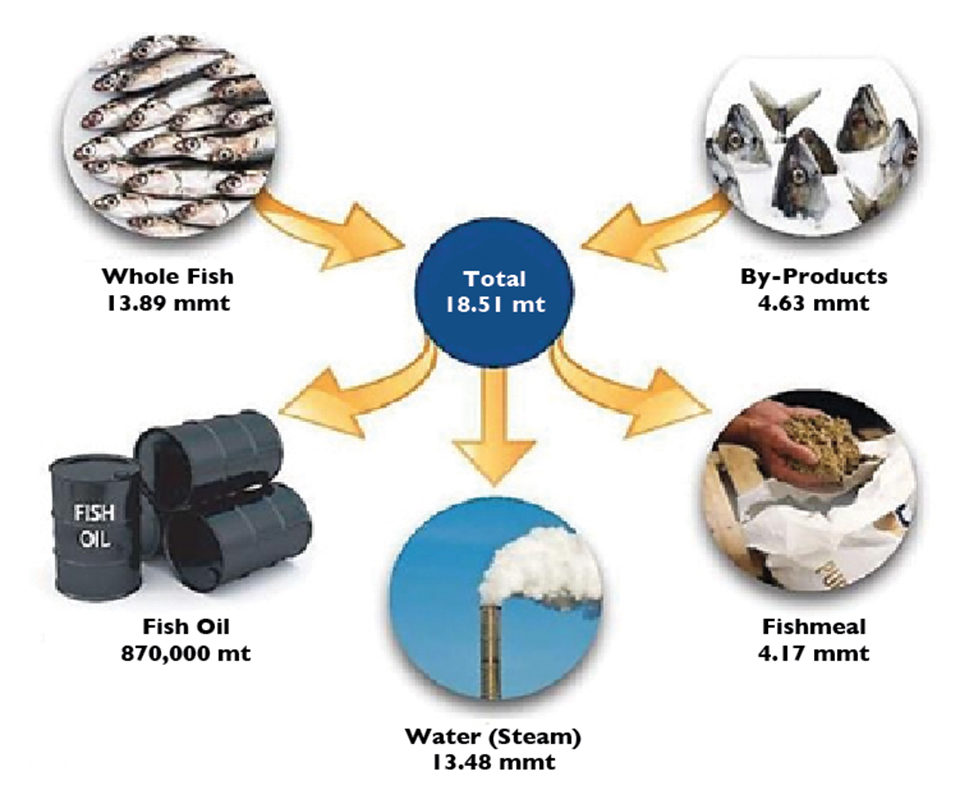
One has to bear in mind that aquaculture is only one part of the picture. In 2010, 73 percent of the fishmeal and 70 percent of the fish oil produced worldwide were used in aquaculture. The rest was used in farm animal feeds and even for direct human consumption. Also, it must be mentioned that 25 percent of the raw material used in the total production of fishmeal and fish oil on a global scale originated from fish by-products (heads, tails and trimmings) destined for direct human consumption and that approximately 73 percent of included water evaporates during the production process.
IFFO Calculations
In order to answer the core question, the International Fishmeal and Fish Oil Organisation (IFFO) has produced calculations for the total use of fishmeal and oil in 2010 (Table 2). For this, IFFO first obtained the quantities of fishmeal and oil used by each species group, as well as their estimated production.
Jackson, IFFO estimates of global fishmeal, Table 2
| Group | Oil (x 1,000 mt) | Meal (x 1,000 mt) | Water (x 1,000 mt) | Total Raw Material (x 1,000 mt) | Whole Fish (x 1,000 mt) | Aquaculture Production (x 1,000 mt) | FIFO |
|---|
Group | Oil (x 1,000 mt) | Meal (x 1,000 mt) | Water (x 1,000 mt) | Total Raw Material (x 1,000 mt) | Whole Fish (x 1,000 mt) | Aquaculture Production (x 1,000 mt) | FIFO |
|---|---|---|---|---|---|---|---|
| Poultry | 0 | 223 | 598 | 821 | 616 | N/A | N/A |
| Pigs | 0 | 816 | 2,184 | 3,000 | 2,250 | N/A | N/A |
| Other farm animals | 0 | 73 | 195 | 268 | 201 | N/A | N/A |
| Other uses | 47 | 0 | 126 | 173 | 130 | N/A | N/A |
| Direct human consumption | 214 | 0 | 573 | 787 | 590 | N/A | N/A |
| Crustaceans | 27 | 875 | 2,413 | 3,315 | 2,486 | 5,476 | 0.45 |
| Sea fish | 95 | 713 | 2,164 | 2,972 | 2,229 | 2,549 | 0.87 |
| Salmon and trout | 420 | 746 | 3,119 | 4,285 | 3,213 | 2,536 | 1.27 |
| Eels | 14 | 164 | 477 | 655 | 491 | 257 | 1.91 |
| Cyprinids | 2 | 140 | 380 | 522 | 392 | 12,171 | 0.03 |
| Tilapia | 27 | 197 | 601 | 826 | 619 | 3,207 | 0.19 |
| Other freshwater fish | 24 | 218 | 649 | 892 | 669 | 4,059 | 0.16 |
| Aquaculture subtotal | 609 | 3,053 | 9,803 | 13,466 | 10,099 | 30,256 | 0.33 |
| Total | 870 | 4,166 | 13,479 | 18,515 | 13,886 |
The sum of oil and meal used in each group was approximately 27 percent of the total weight of the raw material used. With this figure, one can calculate the quantity of lost water, which when added to the sum of the oil and meal ingredients, gave the total amount of raw material used. Knowing that 25 percent of the raw material used originated from by-products of the direct human consumption industry, we can obtain the quantity of whole fish used. With all these figures, it was possible to calculate the FIFO ratios by dividing the estimated production amounts among the quantities of whole fish used.
Marine content
The amounts of fishmeal and oil used in feed vary according to species group. For example, in salmon feeds, the 24 percent fishmeal and 16 percent fish oil percentages were reduced in 2010 as a consequence of the fall in production caused by El Niño. Current percentages for fishmeal and oil are 19 and 11 percent, respectively.
Also, the FCR of 1.57 estimated by IFFO, which in comparison to the 1.25 FCR mentioned earlier, is based on a realistic global picture that includes possible disease episodes with average mortality and average feed quality. To calculate the FIFO ratio on a farm level, it is necessary to use the formula in Fig. 3.

This formula corrects the earlier deficiency of the loss of the extra fishmeal in the Tacon and Metian method. It also takes into account the 25 percent of fishmeal and oil originating from fish by-products destined for human consumption. IFFO’s estimated inclusion levels of fishmeal and oil in salmon feed from whole fish are 12.70 and 9.52 percent, respectively. Therefore the formula would be as shown in Fig. 4.

IFFO’s method is based on weight and provides a complete global picture for each ton. It also identifies how much wild fish is required to produce 1 mt of farmed fish.
Although useful, the Tacon and Metian method tends to obtain high ratios. The EWOS method is the most precise in terms of nutrition, but if fish are fed vegetable oil, this does not transform into fish oil but rather remains as vegetable oil.
Perspectives
Feeding fish to fish is natural. Also, substituting vegetable-based meals for fishmeal can result in lower production. But the most important things are that all the ingredients for feed, including those based on vegetables, are produced in a sustainable manner, and in the case of marine ingredients, originate from fisheries that are managed responsibly.
For these reasons, IFFO has implemented a program for the development of a Global Standard for Responsible Supply that demonstrates in a clear way commitment to responsible practices in feed safety, sourcing and raw material supply.
(Editor’s Note: This article was originally published in the January/February 2013 print edition of the Global Aquaculture Advocate.)
Authors
-

Andrew Jackson
International Fishmeal and Fish Oil Organisation
2 College Yard
Lower Dagnall Street – St. Albans
Hertfordshire, AL3 4PA United Kingdom -
Francisco Aldon
International Fishmeal and Fish Oil Organisation
2 College Yard
Lower Dagnall Street – St. Albans
Hertfordshire, AL3 4PA United Kingdom
Tagged With
Related Posts

Health & Welfare
A look at tilapia aquaculture in Ghana
Aquaculture in Ghana has overcome its historic fits and starts and is helping to narrow the gap between domestic seafood production and consumption. Production is based on Nile tilapia.

Intelligence
‘Spatiotemporal patterns’ indicate improving perceptions of aquaculture
A study led by University of California Santa Barbara researchers has found that public sentiment toward aquaculture improves over time, a potentially important development with growing interest in offshore aquaculture.

Health & Welfare
A comprehensive look at the Proficiency Test for farmed shrimp
The University of Arizona Aquaculture Pathology Laboratory has carried out the Proficiency Test (PT) since 2005, with 300-plus diagnostic laboratories participating while improving their capabilities in the diagnosis of several shrimp pathogens.

Health & Welfare
A holistic management approach to EMS
Early Mortality Syndrome has devastated farmed shrimp in Asia and Latin America. With better understanding of the pathogen and the development and improvement of novel strategies, shrimp farmers are now able to better manage the disease.


