Researchers look at spectroscopy, gene expression profiling and genomic selection

Diseases and meat quality are of high importance to aquaculture producers, processors and consumers. However, both disease resistance and meat quality traits are complex to understand and measure, costly to evaluate and slow to improve using current methods of selective breeding.
A study by the authors funded by the Norwegian Research Council developed and utilized emerging technologies and methods in fish selective-breeding programs to improve the sustainability and profitability of aquaculture. It demonstrated that spectroscopy, gene expression profiling and genomic selection could be used to improve meat quality and disease resistance traits.
Fat, pigmentation measurements
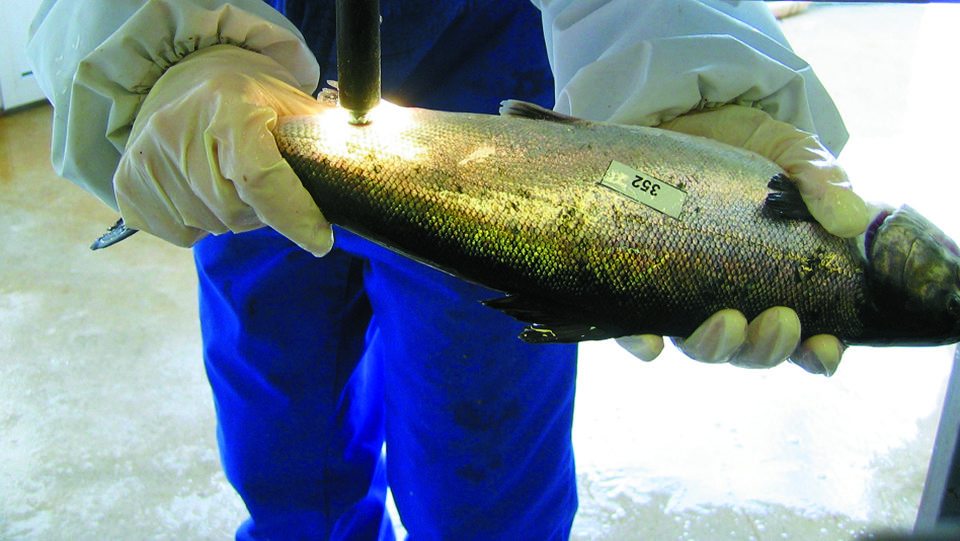
Technology to effectively measure meat quality traits, particularly in live breeding candidates and during growth, has been limited. Successful non-invasive predictions of pigment and fat levels in whole salmon were demonstrated using visible and near infrared (VIS/NIR) spectroscopy. This method provides the ability to study how these traits vary genetically during growth and how to utilize this variation for more cost-efficient and market-adapted production.
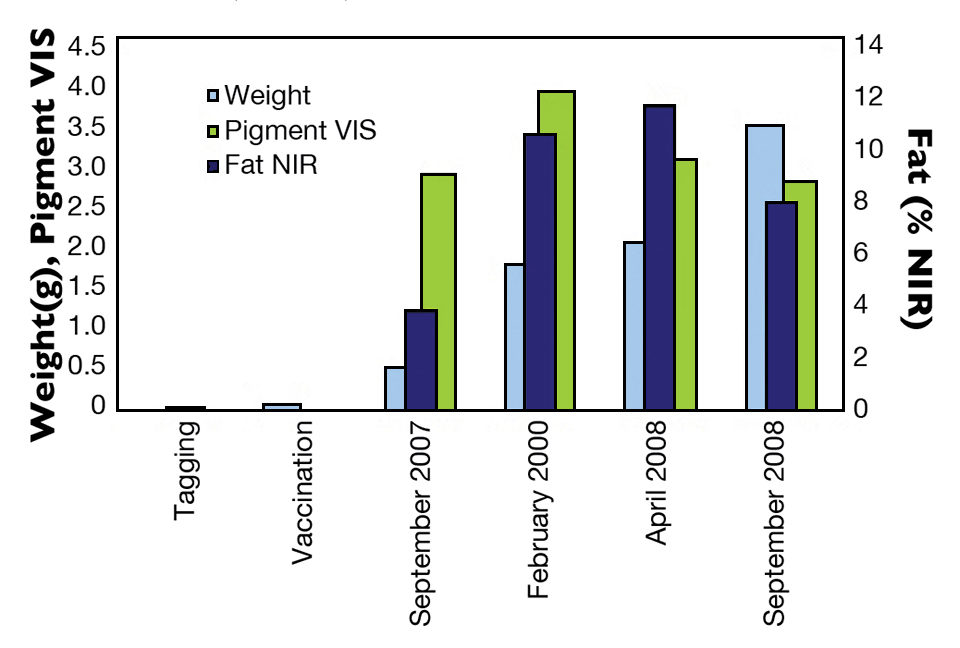
The SalmoBreed breeding company provided 150 full- and half-sib families of Atlantic salmon for the authors’ study. Weight, fillet fat and pigmentation were measured repeatedly by VIS/NIR during one year in the sea (Fig. 1).

Weight showed generally high heritabilities of 0.28 to 0.59. Genetic correlations between repeated measures varied from 0.36 to 0.94 (Table 1). Fillet fat was generally highly correlated with growth and showed highest values in spring. Heritabilities estimated for fillet fat varied between 0.27 and 0.42, while genetic correlations between repeated measures varied between 0.67 and 0.73 (Table 2).
Kolstad, Genetic (above diagonal) and phenotypic (below diagonal), Table 1
| Sept. 2007 | Feb. 2008 | April 2008 | Sept. 2008 | |
|---|---|---|---|---|
| Sept. 2007 | 0.27 (0.04) | 0.73 (0.17) | 0.69 (0.08) | 0.67 (0.12) |
| Feb. 2008 | 1 | 0.39 (0.17) | 0.97 (0.05) | 0.25 (0.24) |
| April 2008 | 1 | 0.73 (0.05) | 0.42 (0.06) | 0.73 (0.09) |
| Sept. 2008 | 1 | 0.27 (0.15) | 0.34 (0.06) | 0.30 (0.07) |
Kolstad, Genetic (above diagonal) and phenotypic (below diagonal), Table 2
| Sept. 2007 | Feb. 2008 | April 2008 | Sept. 2008 | |
|---|---|---|---|---|
| Sept. 2007 | 0.13 (0.03) | N.C. | 0.61 (0.13) | 0.62 (0.16) |
| Feb. 2008 | 1 | 0.08 (0.11) | 0.92 (0.51) | N.C. |
| April 2008 | 1 | 0.18 (0.08) | 0.21 (0.05) | 0.61 (0.16) |
| Sept. 2008 | 1 | N.C. | 0.04 (0.05) | 0.22 (0.06) |
Pigmentation showed lowest values at slaughter and was highest during winter. Despite lower predictive ability for pigmentation, significant heritabilities were estimated, and relatively high correlations of about 0.6 were estimated between repeated measures. Visible spectroscopy may thus be used in selection for increased pigmentation. Weight, fat content and pigmentation were moderate to highly correlated at slaughter (Table 3).
Kolstad, Genetic (above diagonal) and phenotypic (below diagonal), Table 3
| Slaughter | Weight (g) | Fillet fat(%) | Pigment |
|---|---|---|---|
| Weight | 1 | 0.75 (0.08) | 0.47 (0.16) |
| Fillet fat | 0.72 (0.06) | 1 | 0.51 (0.19) |
| Pigment | 0.11 (0.06) | 0.09 (0.06) | 1 |
Consequently, non-invasive measures of pigmentation and fat provide possibilities for a more efficient genetic selection by utilizing within-family variation and more targeted management.
The results indicated that VIS spectroscopy can be used to select for higher pigmentation and that the non-invasive measurement of pigmentation and fat provides possibilities for more rapid genetic improvement and reduced costs. Early measurements using spectroscopy can predict fat levels at slaughter. Genetic correlations between fat measurements were high, but changes in fat deposition can to some extent be done early in the growth phase without affecting the end product.
Gene expression profiling, genomic selection
In other work by the authors, an oligo-nucleotide microarray chip was designed and used to explore important underlying gene expression changes that influence texture and other quality traits. Significant correlations were found between the expression of certain genes and texture. A number of genes were differentially expressed in soft and firm muscle tissue, many coding for mitochondrial proteins.
The authors have also developed statistical means for using gene expression profiles with selective breeding for improved disease resistance. There are thousands of genes behind a trait, while only a few animals are normally tested due to costs. By chance, many gene expression combinations will correlate with the trait in the small data set.
The aim for this study was to develop experimental and statistical means to utilize whole genome expression profiles as a tool for selectively breeding animals with a generally better level of disease resistance. By this, the authors could detect which genes contribute most to predict disease resistance, how many genes to include in the prediction and how to weigh each gene’s expression data in the prediction equation.
A test of the method using a breast cancer data set showed a moderate correlation between estimated and actual phenotype, and demonstrated that this quantitative estimate of phenotype could be used to rank animals for disease resistance. However, trials to determine whether differential expression of genes in vitro before and after infection could be used to predict disease resistance of living breeding candidates have been unsuccessful so far. Resistance to viruses, bacteria and parasites were found to be largely determined by systemic responses.
Gene expression analyses with quantitative polymerase chain reaction predict phenotypes, but only when differences are large. Simulation models have been developed and used to evaluate the cost benefits of the new techniques. Based on the simulation model, selection for disease resistance based on a combination of the challenge test with gene expression profiling was profitable, providing the cost of individual gene expression testing was less than 280 euros ($380). Tools such as microarray analysis are greatly improving our understanding of the underlying genetic mechanisms of disease resistance.
(Editor’s Note: This article was originally published in the March/April 2011 print edition of the Global Aquaculture Advocate.)
Authors
-
Dr. Kari Kolstad
Research Manager, Genetics and Breeding
Nofima
P. O. Box 5010
N-1432 Ås, Norway[111,110,46,97,109,105,102,111,110,64,100,97,116,115,108,111,107,46,105,114,97,107]
-
Dr. Nick Robinson
Nofima
P. O. Box 5010
N-1432 Ås, Norway -
Aleksei Krasnov, Ph.D.
Nofima
P. O. Box 5010
N-1432 Ås, Norway
Related Posts

Health & Welfare
10 paths to low productivity and profitability with tilapia in sub-Saharan Africa
Tilapia culture in sub-Saharan Africa suffers from low productivity and profitability. A comprehensive management approach is needed to address the root causes.

Health & Welfare
A holistic management approach to EMS
Early Mortality Syndrome has devastated farmed shrimp in Asia and Latin America. With better understanding of the pathogen and the development and improvement of novel strategies, shrimp farmers are now able to better manage the disease.

Intelligence
Adding value to tilapia to tap into U.S. market
New markets for tilapia and expansion of existing ones can be created by planning and implementing properly designed geographic strategies to meet discriminating consumer preferences. Low labor costs in most producing countries promotes value-adding by the production of fresh fillets.

Innovation & Investment
AquaGen CEO: Genomics are transforming aquaculture
The CEO of AquaGen knew that the Norwegian research group’s work in genomics was key to the salmon industry’s future. And that was before she even worked there.


