Scalable treatment system can reclaim water discharged from solids-collection devices

Recirculating aquaculture systems allow nearly complete reuse of fish culture process water. However, wastewater accumulated when applying solids capture mechanisms such as rotating drum filters, radial flow clarifiers or sand and bead filters produces backwash or underflow that must be treated prior to discharge from culture facilities.
Membrane biological reactor (MBR) technology is a highly scalable wastewater treatment system with the capacity to reclaim the water discharged from solids-collection devices. Wastewater reclamation can be particularly important when marine species are raised within systems that treat and recirculate brackish or full-strength seawater at inland locations because discharge of the salts to freshwater watersheds could be regulated and also increase farms’ variable costs.
MBRs combine the activated sludge model of conventional activated sludge systems with membranes submerged in the process water capable of filtering particulate waste constituents from the mixed solution. The activated sludge process, which uses a recirculating loop that includes anoxic and aerobic treatment basins, creates an environment suitable for the removal of nitrogen from wastewater through the biological mechanisms of nitrification and denitrification.
Biological phosphorus removal is achieved under alternating aerobic/anoxic conditions as microorganisms take up dissolved phosphorus. Further, the semipermeable membrane can retain particles with sizes of 0.01-10.00 µm while allowing dissolved components and water to pass through.
Pilot-scale study
In a recent experiment conducted at the Conservation Fund’s Freshwater Institute in Shepherdstown, West Virginia, USA, a pilot-scale MBR plant capable of processing 22 m3 of wastewater daily was tested to analyze its capacity to biologically remove nitrogen and phosphorus, consume carbonaceous biological oxygen demand and filter solids and bacteria under sodium chloride concentrations of approximately 0, 8, 16 and 32 ppt. The work was supported by a cooperative agreement with the Agricultural Research Service, United States Department of Agriculture.
Results
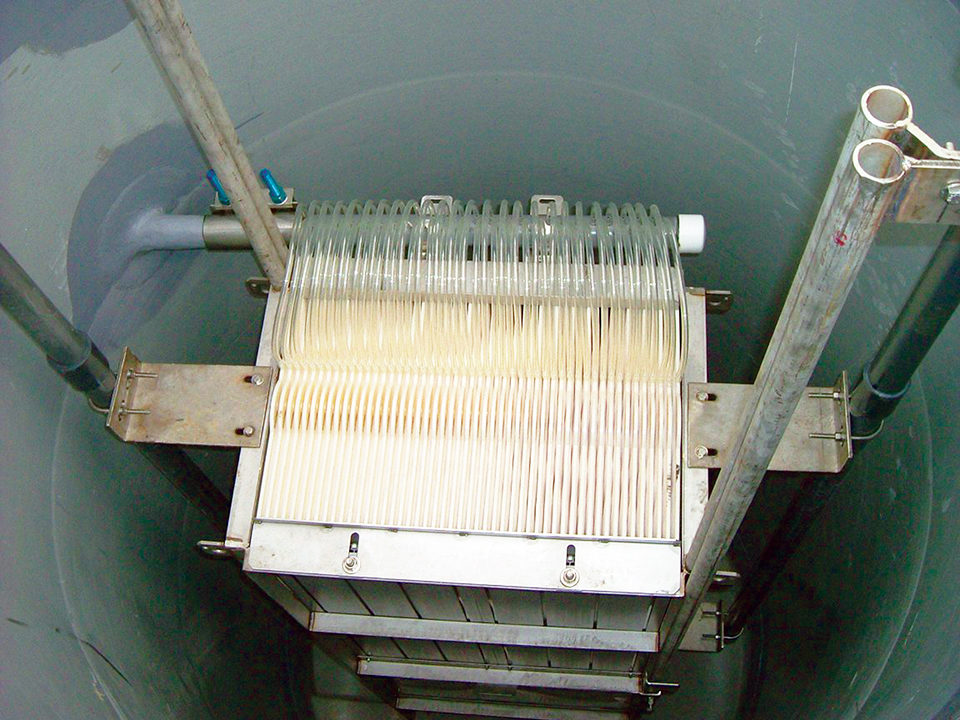
Permeate was processed through a set of 50 flat-panel membranes with a pore size of 0.04 µm, which produced a total flow of approximately 23 l/minute. Physical exclusion of total suspended solids through the membranes resulted in over 99 percent removal efficiencies under all conditions tested (Table 1). Similarly, bacterial exclusion across the membranes resulted in 2.0-5.6 log10 (99.94-99.99999 percent) reduction in total heterotrophic bacteria and 3.2-7.0 log10 (99.95-99.9998 percent) reduction in total coliform bacteria.
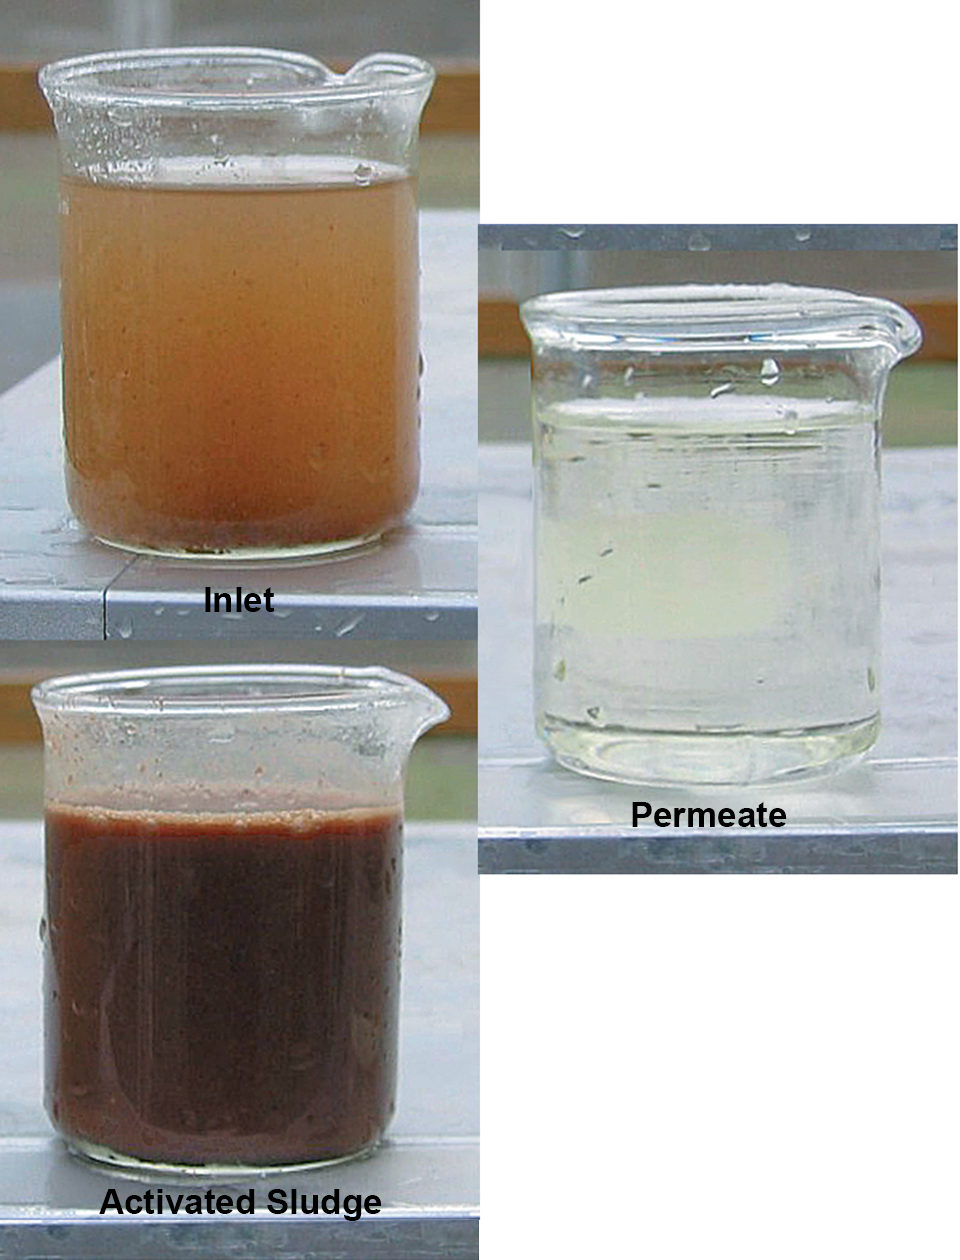
Visual examination of captured permeate flow indicated highly effective particulate removal. Reduction of carbonaceous biological oxygen demand was exceptional, resulting in over 99.8 percent removal efficiencies under all conditions tested (Table 1). No decrease in membrane performance was observed over time.
Biological removal of total nitrogen through nitrification and denitrification was effective under all salinities examined. Results indicated that total nitrogen treatment efficiencies were 92-96 percent (Table 1). Total ammonia nitrogen and nitrate concentrations in the permeate flow were consistently below 2 and 1 mg/l, respectively. However, a microbiological turnover period was observed as nitrifying bacteria acclimated to salinity increasing from 8 to 16 ppt.
When salinity within the MBR was increased from approximately 0 to 8 ppt, no reduction in nitrogen removal capacity was observed, indicating little to no effect on nitrifying bacteria. However, when salinity was increased to 16 ppt, a 110-day acclimation period to the new condition was necessary before steady-state nitrification was achieved. A subsequent increase in salinity from approximately 16 to 32 ppt resulted in no disruption of nitrification.
Sharrer, Membrane biological reactor performance, Table 1
| 0 ppt | 8 ppt | 16 ppt | 32 ppt |
|---|
0 ppt | 8 ppt | 16 ppt | 32 ppt | |
|---|---|---|---|---|
| Total suspended solids Inlet (mg/l) ± S.E. Permeate (mg/l) ± S.E Removal (%) | Total suspended solids 1,688.00 ± 302.00 0.30 ± 0.10 99.98 ± 0.01 | Total suspended solids 1,732.00 ± 436.0 1.20 ± 0.20 99.90 ± 0.20 | Total suspended solids 1,357.00 ± 296.00 1.30 ± 0.10 99.83 ± 0.03 | Total suspended solids 754.00 ± 64.00 2.50 ± 0.70 99.65 ± 0.10 |
| Carbonaceous biological oxygen demand Inlet (mg/l) ± S.E. Permeate (mg/l) ± S.E Removal (%) | Carbonaceous biological oxygen demand 1,075.00 ± 145.00 1.00 ± 0.90 99.91 ± 0.02 99.99 ± 0 | Carbonaceous biological oxygen demand 1,583.00 ± 410.00 1.30 ± 0.03 99.91 ± 0.02 | Carbonaceous biological oxygen demand 930.00 ± 281.00 0.70 ± 0.10 99.87 ± 0.04 | Carbonaceous biological oxygen demand 372.00 0.60 99.84 |
| Total nitrogen Inlet (mg/l) ± S.E. Permeate (mg/l) ± S.E Removal (%) | Total nitrogen 68.40 ± 12.90 3.90 ± 1.30 91.80 ± 2.90 | Total nitrogen 67.30 ± 3.60 3.10 ± 0.70 93.00 ± 2.00 | Total nitrogen 62.40 ± 22.40 2.60 ± 0.40 93.90 ± 1.00 | Total nitrogen 50.70 ± 5.70 2.00 ± 0.20 95.50 ± 0.60 |
| Total ammonia nitrogen Inlet (mg/l) ± S.E. Permeate (mg/l) ± S.E Removal (%) | Total ammonia nitrogen 4.10 ± 0.70 1.40 ± 0.70 57.40 ± 19.20 | Total ammonia nitrogen 1.90 ± 0.30 1.80 ± 0.60 13.70 ± 22.80 | Total ammonia nitrogen 4.50 ± 2.50 0.40 ± 0.10 78.30 ± 6.60 | Total ammonia nitrogen 2.60 ± 0.40 2.00 ± 1.20 28.10 ± 42.00 |
| Total phosphorus Inlet (mg/l) ± S.E. Permeate (mg/l) ± S.E Removal (%) | Total phosphorus 57.20 ± 14.40 1.50 ± 0.30 96.10 ± 1.00 | Total phosphorus 38.70 ± 8.60 8.20 ± 0.50 72.70 ± 3.50 | Total phosphorus 24.60 ± 4.90 6.20 ± 0.30 70.40 ± 2.30 | Total phosphorus 19.20 ± 1.90 6.20 ± 0.50 65.20 ± 5.40 |
The MBR’s capacity to remove phosphorus appeared compromised under the high-salinity conditions. When operated at approximately 0 ppt salinity, permeate total phosphorus removal efficiency was approximately 96.1 percent. At salinities of 8, 16 and 32 ppt, phosphorus removal efficiencies were 72.7, 70.4 and 65.2 percent, respectively. The data indicated an inhibition of biological phosphorus removal by denitrifying bacteria at higher salinities. Further, reduced capacity of phosphorus removal was observed regardless of prolonged microbiological acclimation periods.
Advantages of MBRs
The advantages of the MBR system include its relative ease of operation and lack of extensive maintenance requirements. Automated monitoring features allow minimal personnel commitment. Dissolved-oxygen requirements can be maintained under optimum conditions for months by the dissolved-oxygen monitor and proportional integral derivative controller.
Float switches mounted in the anoxic tank allow the reactors to maintain proper depth, processing permeate water and accepting microscreen drum filter backwash flows from an equalization tank as needed. Membrane fouling is automatically mitigated through programmable logic controller procedures in which daily membrane air-scouring events prevent excessive build-up of biological material.
Operator maintenance duties are minimal. Daily checks are required to ensure proper function of critical components, verify recommended transmembrane pressure ranges and confirm dissolved-oxygen levels in both the aerobic and anoxic tanks. Sludge is removed weekly from the MBR system to maintain thesuspended solids within the desired range. Biannual chemical cleaning of membranes with sodium hypochlorite and hydrochloric acid to reduce biological and chemical fouling requires the MBR pump to be inoperative for only an hour or two.

The MBR system footprint of 153 square meters, including working room around the equipment, is small relative to the 1,830-square-meter imprint of the fish culture facility. A key feature of the MBR system is the ability to site it in a location removed from the fish culture facility, which allows for biosolids treatment and water reclamation in a biosecure setting. Also, the scalability of MBR technology allows for package systems suited to the needs of users and relatively easy plant expansion.
Membrane biological reactor technology has remarkable potential to treat biosolids backwashed from recirculating aquaculture systems. Fish production facilities reliant upon public treatment works for wastewater processing or interested in reclamation of saline water at inland locations may realize considerable benefit from this on-site waste treatment system.
In fact, several large North American producers utilizing recirculating technology are seriously considering the installation of MBR plants. Although capital and operating costs for MBR systems are significant, their ability to treat effluents to stringent standards as well as support reclamation and reuse of wastewater is attractive.
Editor’s note: This article is a summary of a 2007 article by the authors that appeared in Aquaculture Engineering.
(Editor’s Note: This article was originally published in the July/August 2008 print edition of the Global Aquaculture Advocate.)
Now that you've finished reading the article ...
… we hope you’ll consider supporting our mission to document the evolution of the global aquaculture industry and share our vast network of contributors’ expansive knowledge every week.
By becoming a Global Seafood Alliance member, you’re ensuring that all of the pre-competitive work we do through member benefits, resources and events can continue. Individual membership costs just $50 a year. GSA individual and corporate members receive complimentary access to a series of GOAL virtual events beginning in April. Join now.
Not a GSA member? Join us.
Authors
-
Mark J. Sharrer
The Conservation Fund’s Freshwater Institute
1098 Turner Road
Shepherdstown, West Virginia 25443 USA -
Joseph A. Hankins
The Conservation Fund’s Freshwater Institute
1098 Turner Road
Shepherdstown, West Virginia 25443 USA -

Steven T. Summerfelt, Ph.D.
The Conservation Fund’s Freshwater Institute
1098 Turner Road
Shepherdstown, West Virginia 25443 USA
Tagged With
Related Posts

Responsibility
A look at various intensive shrimp farming systems in Asia
The impact of diseases led some Asian shrimp farming countries to develop biofloc and recirculation aquaculture system (RAS) production technologies. Treating incoming water for culture operations and wastewater treatment are biosecurity measures for disease prevention and control.

Responsibility
Advances in super-intensive, zero-exchange shrimp raceways
Research at the Texas AgriLife Research Mariculture Laboratory is investigating ways to improve the economic viability of super-intensive raceways for shrimp production.

Health & Welfare
Antimicrobial resistance: Aquaculture to humans, humans to aquaculture?
The transfer of resistance from an aquaculture pathogen into a human enteric bacterium has been demonstrated in research and may be happening in the real-world environment.

Responsibility
Aquaculture byproducts improve sustainability of seafood value chains
Tons of aquaculture byproducts are available as sources for fishmeal and fish oil to supplement the supplies obtained from fisheries. Innovative technologies are supporting more efficient use of these by-products in aquafeed.


