USEPA should consider system variables in setting new effluent rules
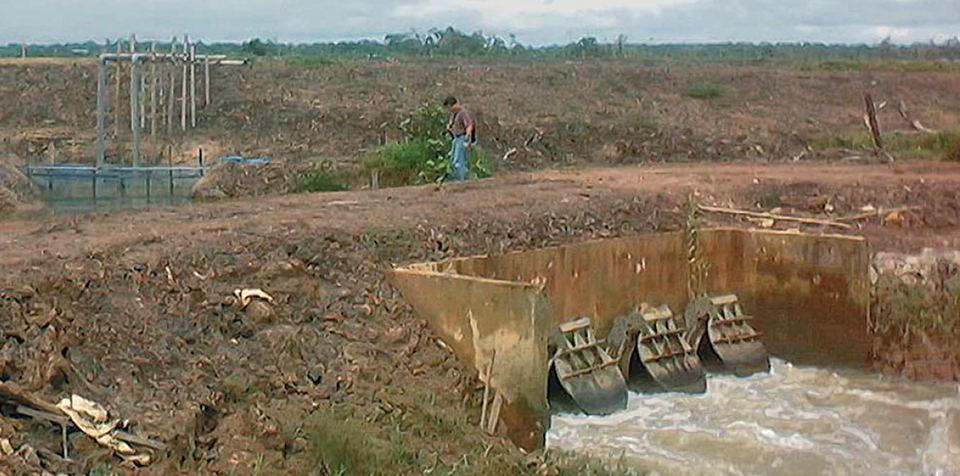
Additions of nitrogen and phosphorus to natural waters can cause eutrophication. Thus, the discharge of these nutrients from aquaculture operations is an issue in the rule-making process for aquaculture effluents being conducted by the United States Environmental Protection Agency (USEPA).
This aquaculture effluent rule, due on June 30, 2004, will apply to all U.S. aquaculture. Moreover, some other nations will use it as a model for formulating their regulations. It is important that USEPA uses reliable information on the nutrient amounts typically released from aquaculture facilities in formulating the rule. Since nitrogen and phosphorus loads from different types of aquaculture vary, rules for aquaculture effluents should differentiate among production systems.
System nutrient loads
Feeds applied in commercial aquaculture increase production above that possible from natural food sources. Fertilizers seldom are major sources of nitrogen and phosphorus in aquaculture systems considered here.
Nutrient loads to a production system can be estimated as the amounts of nitrogen and phosphorus in feed, minus quantities of these two nutrients in aquatic animals at harvest. For example, suppose that 1,000 kg of feed applied to a pond gives 526 kg of fish. This reflects a feed conversion ratio (FCR) (feed ÷ fish) of 1.9. Assuming that feed contains 4.8 percent nitrogen and 0.9 percent phosphorus, and fish are 25 percent dry matter that contains 9 percent nitrogen and 2.7 percent phosphorus, the system nutrient loads per 1,000 kg feed are:
Nutrient inputs in feed
1,000 kg feed x 0.048 kg N/kg feed = 48 kg N
1,000 kg feed x 0.009 kg P/kg feed = 9 kg P
Nutrient removal in fish
526 kg fish x 0.25 kg dry matter/kg fish x 0.009 kgN/kg dry matter = 11.8 kg N
526 kg fish x 0.25 kg dry matter/kg fish x 0.027 kg P/kg dry matter = 3.6 kg P
System nutrient loads
48 kg N in feed – 11.8 kg N in fish = 36.2 kg N/1,000 kg feed
9 kg P in feed – 3.6 kg P in fish = 5.4 kg P/1,000 kg feed
System nutrient loads for several typical culture conditions and methods are provided in Table 1. Nitrogen loads are 61.9 to 77.2 percent of feed inputs, while phosphorus loads are 43.8 to 89.4 percent of feed inputs. The most obvious difference among the loads is that fish are more efficient than shrimp in retaining phosphorus from feed. Because shrimp do not have bone, they contain much lower phosphorus concentrations than fish. Bone is comprised mainly of calcium phosphate.
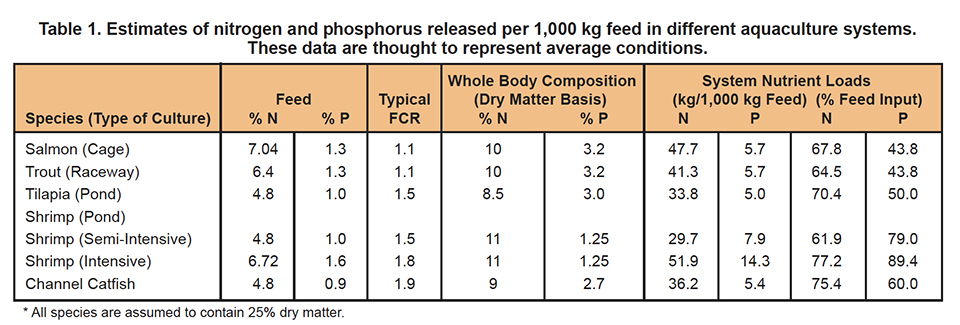
In pond aquaculture, some farmers obtain much lower FCR than reported in Table 1. System nutrient loads are less for lower FCR, but this report uses typical FCR values.
Environmental nutrient loads
Cages and raceways
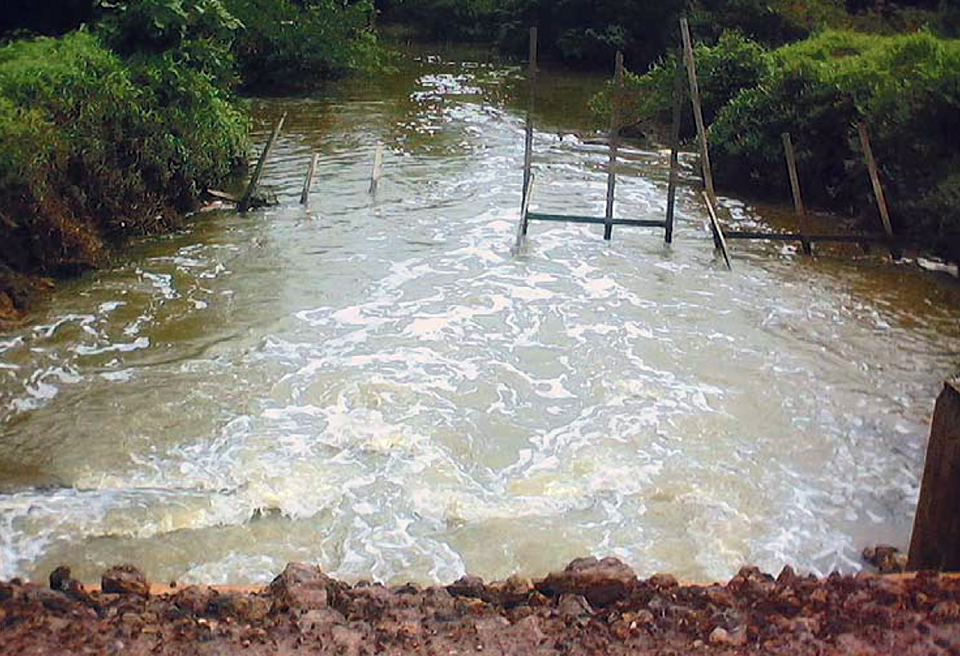
Other than for cage culture in public waters, the Table 1 analysis does not provide meaningful estimates of the nutrient loads imposed by aquaculture wastes. In cage culture of salmon or any other species, all nutrients not retained in fish enter the surrounding water. These systems have the greatest potential among aquaculture systems for releasing nutrients. If cages are suspended in public waters, nutrient discharges depicted in Table 1 are realized.
Little can be done to lessen loads other than improve feed-conversion efficiency or reduce nitrogen and phosphorus concentrations in feeds. However, today’s high-energy salmonid diets with highly digestible fishmeal have decreased FCR to nearly 1.0 in many commercial systems. But there is a limit to how much nitrogen and phosphorus concentrations can be reduced without sacrificing feed quality.
In trout raceways, nutrients not retained in fish are flushed from raceways and may enter public waters. However, raceways often incorporate sedimentation areas to remove feces and uneaten feed. This can lessen nutrient discharge, but a great proportion of the nitrogenous waste and some of the phosphorus from trout culture enters water as ammonia and soluble phosphorus, and cannot be removed by sedimentation.
Ponds
 Pond culture is different from cage or raceway culture because water is retained within the culture system for long periods before it is discharged into public waters. This allows ponds to assimilate nitrogen and phosphorus and lessen loads of these nutrients in effluents.
Ammonia excreted into pond waters by fish and shrimp can enter in one or more of several pathways. It can be absorbed by phytoplankton bacteria, and converted to organic nitrogen. It can be oxidized to nitrate by nitrifying bacteria. Or it can enter the atmosphere by volatilization.
Nitrate can be converted to nitrogen gas by denitrifying bacteria and lost from the pond. Dead plankton, uneaten feed, and feces settle to the pond bottom and accumulate in sediment as organic matter. Organic nitrogen can be recycled to the water as ammonia after bacterial decomposition.
 Plankton and other particulate organic matter are not flushed directly from ponds to the environment unless ponds are drained. Phosphorus is quickly and strongly adsorbed by sediment or precipitated from water as calcium phosphate. Sediment phosphorus has low solubility and is largely unavailable to reenter the water column.
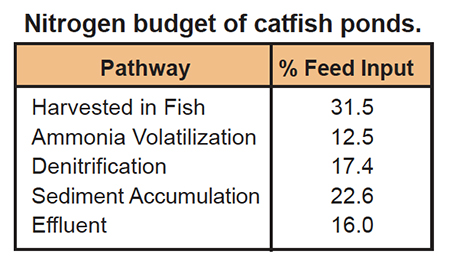
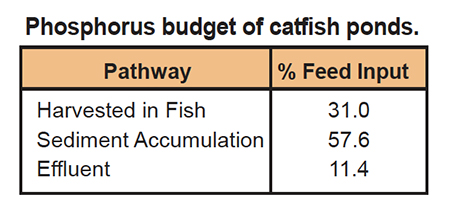
Nitrogen and phosphorus budgets of channel catfish ponds provide estimates of the percentages of feed inputs of these nutrients entering different pathways as follows.
One study revealed that 28.5 percent of nitrogen and 7 percent of phosphorus applied in feed was contained in pond effluent.
The information above for annually drained channel catfish ponds, with overflow only after heavy rainfall, suggests that 15 to 30 percent of nitrogen and around 10 percent of phosphorus applied in feed are released in effluent. Of course, most catfish ponds are drained only twice in 15 to 20 years, and much less nitrogen and phosphorus than estimated above are actually discharged.
Assimilation processes are similar in ponds for most kinds of fish and shrimp culture, so the discussion of channel catfish ponds is applicable to most pond aquaculture systems without water exchange. Reasonable estimates for environment nutrient loads appear to be around 10 kg N and 1 kg P per 1,000 kg feed for tilapia, channel catfish, and semi-intensive shrimp culture in static, annually drained ponds. This is about one-fourth as much nitrogen and one sixth as much phosphorus as would be released into the environment in cage culture of salmon or raceway culture of trout.
However, it should be emphasized these estimates of percentages of feed, nitrogen, and phosphorus entering different pathways are for ponds stocked and fed at normal commercial rates. There is not a strong correlation between feed input and nutrient concentrations in pond water or effluents.
Water exchange
Water exchange shortens water retention time in ponds and decreases the capacity of ponds to assimilate nutrients. Assume that a 1-m-deep shrimp pond receives 4,000 kilograms per hectare feed containing 1.6 percent phosphorus over a 100-day production period. The water exchange rate is 10 percent of pond volume per day. Water exchange effluent from ponds at this feeding rate typically contains about 0.18 milligrams per liter total phosphorus. The phosphorus load during a single crop in water exchange effluent is:
100 days × 10,000 square meters per hectare × 1m x 0.1 = 100,000 cubic meters of effluent
100,000 cubic meters × 0.18 grams P per cubic meter × 10-3 = 18 kg P in effluent
The feed input of phosphorus is 64 kg (4,000 kg feed x 0.016), and water exchange effluent contains 28 percent of phosphorus added in feed. About 10 percent more of feed phosphorus will be contained in effluent released when the pond is drained for harvest. In all, about 40 percent of feed phosphorus will be released in effluent.
Improving assimilation capacity
Ponds’ large capacity to assimilate nitrogen and phosphorus from feed reduces the environmental nutrient load. Ponds should be managed to protect water quality and maximize their capacity to assimilate organic matter, nitrogen and phosphorus.
Management practices useful for maintaining or enhancing assimilation capacity include:
- Use good-quality feeds.
- Avoid overfeeding.
- Use stocking and feeding rates that do not cause dissolved oxygen concentrations to fall below 3 milligrams per liter at night.
- Use mechanical aeration to prevent low dissolved oxygen.
- Where feasible, do not drain ponds for harvest.
- Do not use water exchange or reduce water-exchange rates as much as practical.
- Dry pond bottoms between crops.
- Lime acidic pond waters and soils
- Use pond fertilizers only when necessary to promote plankton blooms.
Conclusion
Ponds are different from cages and raceways because they do not discharge nitrogen and phosphorus on a daily basis and have a large capacity to assimilate these nutrients. Ponds also serve as sedimentation basins with water retention times of many days or even months.
There is no relationship between nutrient inputs to ponds and nutrient concentrations in pond waters and effluents unless the assimilation capacity of ponds is exceeded. This point is illustrated by a study in which feeds containing 0.58, 0.68, 0.75, 0.81 and 0.99 percent phosphorus were applied in equal amounts to channel catfish ponds as treatments. Concentrations and loads of phosphorus in pond waters and effluents did not differ among treatments.
In Europe, considerable attention has been given to limiting inputs of nitrogen and phosphorus in feed to fish cages as a means of reducing environmental loads. This approach is not suitable for pond culture, for no improvement in effluent quality would occur as a result of feed limitation in ponds where assimilation capacity has not been exceeded.
Depending upon the culture species and method, there is a feeding rate above which pond water quality deteriorates due to loss of assimilation capacity. In channel catfish culture in static ponds, this feeding rate is about 30 kilograms per hectare per day in ponds without aeration and 120 kilograms per hectare per day in ponds aerated at 3 to 4 horsepower per hectare.
Similar relationships between feeding rates and water quality also occur in shrimp ponds without water exchange. However, much more feed can be applied in tilapia ponds and in shrimp ponds with water exchange. The rate increases in proportion to the aeration level.
Best management practices to prevent the exceeding of assimilation capacity of ponds should be emphasized in aquaculture effluent rules. Such practices could recommend upper limits on feed input based on aeration and water exchange levels. However, there is no scientific basis for assuming a direct relationship between the feeding rate and effluent quality.
(Editor’s Note: This article was originally published in the December 2001 print edition of the Global Aquaculture Advocate.)
Now that you've finished reading the article ...
… we hope you’ll consider supporting our mission to document the evolution of the global aquaculture industry and share our vast network of contributors’ expansive knowledge every week.
By becoming a Global Seafood Alliance member, you’re ensuring that all of the pre-competitive work we do through member benefits, resources and events can continue. Individual membership costs just $50 a year. GSA individual and corporate members receive complimentary access to a series of GOAL virtual events beginning in April. Join now.
Not a GSA member? Join us.
Authors
-
Claude E. Boyd, Ph.D.
Department of Fisheries and Allied Aquacultures
Auburn University
Auburn, Alabama 36849 USA -
Julio F. Queiroz
Embrapa Meio Ambiente
Jaguariuna, SP, Brasil
Tagged With
Related Posts

Responsibility
A review of water quality improvement products
Prof. Boyd examines products used by aquafarmers to improve water quality and conditions in their ponds and discusses their efficacy.

Aquafeeds
Animal byproduct concentrates useful tools in formulation
With the market volatility of fishmeal, as well as rising sustainability concerns, the aquaculture industry is seeking sources of protein, such as animal byproduct concentrates, to substitute for fishmeal.

Responsibility
Aquaculture effluent partially replaces growing mix for plant production
Aquaculture effluent can be an effective fertilizer in land-based plant production. Research with tilapia utilized dewatered aquaculture effluent (A.E.) as a partial substrate replacement for tomato plant seedlings. Seedling growth decreased when effluent replaced a commercial growing mix at 25 percent or more.

Aquafeeds
Aquaculture feed composition helps define potential for water pollution
A study found that feed for salmon and trout had higher organic carbon concentrations than did catfish, shrimp and tilapia feeds. Nitrogen and phosphorus concentrations were similar among salmon, trout and shrimp feeds, and higher than those in catfish and tilapia feeds.


