Opportunity for the genetic improvement of fatty acid profiles, appearance, texture
 In farm animal breeding, carcass and meat quality traits have long been included in multiple-trait selection indices to improve or stabilize meat quality. Traits that directly influence both product yield and consumer preference – dressing percentage, fillet yield, meat color and texture, and fat content – have been incorporated in commercial fish-breeding programs, especially for salmonids.
Comprehensive genetic studies on body composition and carcass quality have been conducted for farmed salmon, rainbow trout, and cod. Current shrimp-breeding programs, however, are primarily focused on selection for growth rate, survival, and disease resistance. There is almost no genetic information available for shrimp carcass and meat quality.
To help develop a selection program for shrimp carcass and meat quality, the authors recently examined the traits of interest at the phenotypic level and assessed the potential for genetic selection. Although phenotypic correlations do not necessarily reflect the underlying genetic correlations, they can be related.
Traits of interest
Shrimp samples were collected from trials in which 80 different families were grown out at a density of 100 shrimp per square meter. The shrimp had previously been subjected to genetic selection for growth rate for six generations.
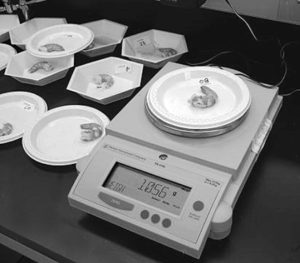
At harvest, about 2,700 shrimp were individually weighed, packed in labeled bags, and quick frozen prior to processing. Mean harvest weight and survival for all families were 23.3 grams (range 20.3 to 27.9 grams) and 81.8 percent (range 51.4 to 100 percent), respectively.
Shrimp yield traits, product characterization, and sensory attributes were measured on individual shrimp, whereas proximate composition and fatty acid profiles of shrimp meat were assessed on samples pooled per family.
Quality variability

Shrimp carcass traits were evaluated in parallel at two laboratories. Although great efforts were made to standardize measurement procedures, differences between the laboratories’ sample handling/processing had a significant influence on estimates of carcass and meat quality traits.
Mean values for shrimp shell-on tail yield, raw meat yield, and cooked meat yield were 68.0 percent, 52.4 percent, and 46.5 percent, respectively (Table 1). Coefficients of variation for these traits were relatively low, ranging 2.7 to 4.7 percent. Weight loss during cooking accounted for 11.0 percent of shrimp raw meat, with a standard deviation of 2.35 percent.
Jiang, Mean and variability parameters for main carcass, Table 1
| Tail % | Shrimp Yield Traits Raw Meat % | Shrimp Yield Traits Cooked Meat % | Shrimp Yield Traits Cook Loss % (% Raw Meat) | Cooked Meat Appearance Score | Cooked Meat Texture |
|---|
Tail % | Shrimp Yield Traits Raw Meat % | Shrimp Yield Traits Cooked Meat % | Shrimp Yield Traits Cook Loss % (% Raw Meat) | Cooked Meat Appearance Score | Cooked Meat Texture | |
|---|---|---|---|---|---|---|
| Overall mean | 68.0 | 52.4 | 46.5 | 11.0 | 2.56 | 2.47 |
| Overall standard development | 1.82 | 2.08 | 2.17 | 2.35 | 1.03 | 0.43 |
| Within-family CV (%) | 2.54 | 3.76 | 4.38 | 19.27 | 36.77 | 14.72 |
| Btw-family CV (%) | 0.90 | 1.25 | 1.78 | 10.08 | 17.31 | 10.01 |
| h2 estimate | 0.22 | 0.14 | 0.20 | 0.36 | 0.27 | 0.37 |
Shrimp shell thickness was categorized in six classes: very soft, soft, thin, acceptable, hard, and very hard. Shell peelability was categorized in five classes: very easy, easy, acceptable, hard, and very hard to peel. About 75 percent of the shrimp evaluated had “hard” shells, and 89.7 percent were “easy” to peel. No apparent family effects were observed for these traits.
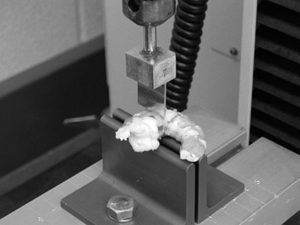
The visual appearance of raw and cooked shrimp, and flavor of cooked meat were subjectively graded by a trained sensory panel using a set of nine predefined scores, where a lower score indicated a more appealing product. Texture was measured by shear force in kilograms. Results revealed large variability for appearance and texture of cooked shrimp meat, with little variation in shrimp flavor. Techniques for evaluating shrimp flavor have to be improved before they can be used for genetic selection purposes.
Statistical analyses revealed significant (P < 0.05) family effects for all shrimp yield and most sensory traits. Heritability estimates of shrimp carcass traits varied 0.14 to 0.37.
Composition
Proximate analysis showed little variability for shrimp meat composition (moisture, protein, ash, and energy), as indicated by their low coefficients of variation (Table 2). Compared with other aquatic species, the lipid content of shrimp meat is low, only 4.4 percent of dry matter.
Jiang, Means, standard deviations, and coefficients of variation for proximate composition, Table 2
| Moisture (%) | Proximates (% dry matter) Protein (%) | Proximates (% dry matter) Fat (%) | Proximates (% dry matter) Ash (%) | Proximates (% dry matter) Calories (kcal/100 g) | Fatty Acid Profiles (% fat) Saturated FA | Fatty Acid Profiles (% fat) MUFA | Fatty Acid Profiles (% fat) PUFA | Fatty Acid Profiles (% fat) PUFA Omega-3 | Fatty Acid Profiles (% fat) PUFA Omega-6 |
|---|
Moisture (%) | Proximates (% dry matter) Protein (%) | Proximates (% dry matter) Fat (%) | Proximates (% dry matter) Ash (%) | Proximates (% dry matter) Calories (kcal/100 g) | Fatty Acid Profiles (% fat) Saturated FA | Fatty Acid Profiles (% fat) MUFA | Fatty Acid Profiles (% fat) PUFA | Fatty Acid Profiles (% fat) PUFA Omega-3 | Fatty Acid Profiles (% fat) PUFA Omega-6 | |
|---|---|---|---|---|---|---|---|---|---|---|
| Mean | 74.94 | 88.10 | 4.44 | 7.12 | 395.2 | 44.63 | 24.46 | 31.80 | 18.32 | 12.92 |
| Standard development | 0.59 | 1.16 | 0.41 | 0.23 | 3.95 | 15.15 | 6.59 | 10.16 | 6.76 | 6.09 |
| Coefficient of variance (%) | 0.8 | 1.3 | 9.2 | 3.2 | 1.0 | 34.0 | 27.0 | 32.0 | 36.9 | 47.1 |
There existed, however, a large variation in fatty acid profiles, especially for polyunsaturated fatty acids (PUFAs, including omega-3 and omega-6) that are of high nutritional value for human health. Part of the high coefficients of variation for fat content and fatty acid profiles could result from their relatively low concentrations and the detection limits of the analytical methods employed.
Correlations among traits
It was somewhat surprising that tail yield was not significantly correlated to raw or cooked meat yields when these traits were analyzed on an individual basis, but positively correlated when analyzed using family means. Cooking loss is a trait of economic importance, consisting predominantly of a protein-water mixture caused by a decrease in water-holding capacity during protein denaturation and an elevated internal pressure due to shrinkage of the connective tissues. Cooked meat yields were negatively correlated with cooking loss, as expected.
Larger shrimp tended to have greater tail yields, lower cooking loss, and higher texture scores. Shrimp size did not significantly impact the composition of raw meat, product characterization, or sensory attributes. PUFAs (especially omega-6), however, were positively correlated with shrimp size/growth. No correlation was found between shrimp survival and carcass or meat quality traits.
At 68.5 percent, males had significantly larger tail ratios than females (67.7 percent), but no significant difference for raw and cooked meat yields existed between sexes. Males also had lower cooking losses (10.6 percent) than females (11.2 percent), which can not be explained by size difference due to sexual dimorphism. No significant sex effect was found for any other traits.
Shell thickness and peelability, two important factors for evaluating commercial shrimp products, were highly correlated. Shell thickness also highly correlated with appearance and texture. Hard-shell shrimp that were easy to peel tended to have more favorable scores for the appearance of raw shrimp and cooked meat, and higher texture scores than hard-to-peel, soft-shell shrimp.
The appearance of raw and cooked shrimp was positively correlated, whereas the correlations between the texture of cooked meat and both appearances were negative. This indicated that shrimp of more appealing appearance might have tough-er meat.
Opportunity for genetic improvement
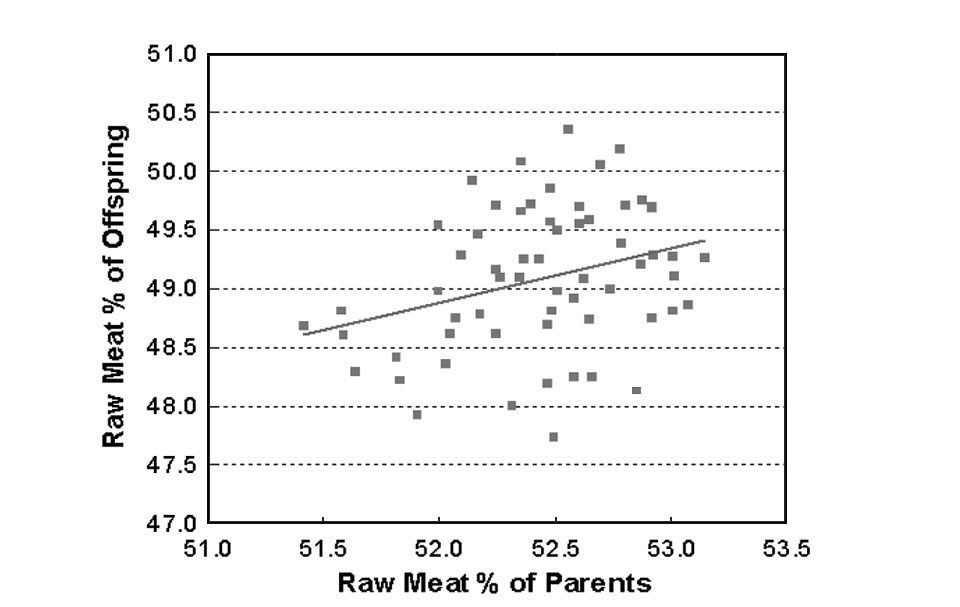
To the authors’ knowledge, this was the first large-scale study with systematic collection of quantitative data on such traits. The results revealed considerable opportunity for the genetic improvement of traits such as fatty acid profiles (especially PUFAs), appearance, texture, and cooking loss. Heritabilities for most shrimp carcass and meat quality traits were moderate to high (Fig. 1), comparable to those reported for livestock and farmed fish species.

Shrimp carcass traits, including tail, raw meat and cooked meat yields, are important characteristics that are highly valued by shrimp-processing companies. Measurements of these traits on individual shrimp are labor-intensive, costly, and difficult to standardize. For a breeding program based on a combination of family and individual selection, the measurements could be obtained on a family basis using pooled shrimp samples.
(Editor’s Note: This article was originally published in the February 2005 print edition of the Global Aquaculture Advocate.)
Now that you've finished reading the article ...
… we hope you’ll consider supporting our mission to document the evolution of the global aquaculture industry and share our vast network of contributors’ expansive knowledge every week.
By becoming a Global Seafood Alliance member, you’re ensuring that all of the pre-competitive work we do through member benefits, resources and events can continue. Individual membership costs just $50 a year. GSA individual and corporate members receive complimentary access to a series of GOAL virtual events beginning in April. Join now.
Not a GSA member? Join us.
Authors
-
Donghuo Jiang, Ph.D.
Sygen International
3033 Nashville Road
Franklin, Kentucky 42134 USA -
Joao L. Rocha, Ph.D.
Sygen International
3033 Nashville Road
Franklin, Kentucky 42134 USA -
Hein van der Steen, Ph.D.
Sygen International
3033 Nashville Road
Franklin, Kentucky 42134 USA -
Steve Otwell, Ph.D.
Aquatic Food Products Laboratory
University of Florida
Gainesville, Florida, USA -
Shaun Moss, Ph.D.
The Oceanic Institute
Waimanalo, Hawaii, USA
Tagged With
Related Posts

Health & Welfare
Dietary acidifier potassium diformate improves growth, survival in pangasius
As examined in various studies, potassium diformate can improve the growth and health status of pangasius when the dietary acidifier is included in feed.

Health & Welfare
Evaluating biofloc technology for the freshwater fish piracanjuba
This study evaluated the growth performance of the freshwater fish piracanjuba raised in biofloc and clear-water systems for 34 days.

Innovation & Investment
Jet-setting: Turning aquaculture wastewater into aviation fuel
The Seawater Energy and Agriculture System at Khalifa University in Masdar City, UAE, is applying aquaculture concepts to biofuel production for airlines.

Aquafeeds
It takes guts to advance sustainability in aquaculture
With byproducts representing between 25 to 50 percent of the weight of various fish species, we need to be looking at how the entire fish is being used: even the heads, guts and skin.


