Model examines profitability using recirculating systems

An important constraint to more widespread development of commercial flounder grow-out farms in the United States is the identification of profitable methods of culturing juveniles to a marketable size using recirculating technology.
Recent studies have lacked the data needed to construct detailed, empirical production relationships because published data on the growout of summer flounders on a commercial scale was not available. As a result, potential investors have been forced to rely on assumed values for key engineering and biological parameters.
In cooperative research recently conducted by the University of North Carolina at Wilmington (UNCW) and North Carolina State University (NCSU), the authors developed an economic model for recirculating aquaculture production of summer flounders based on parameters derived from UNCW’s pilot-scale recirculating system in Wrightsville Beach, North Carolina, USA. The model examines the potential profitability of summer flounder aquaculture using recirculating systems and can determine the sensitivity of financial performance to changes in biological, engineering, and economic parameters.
Model development

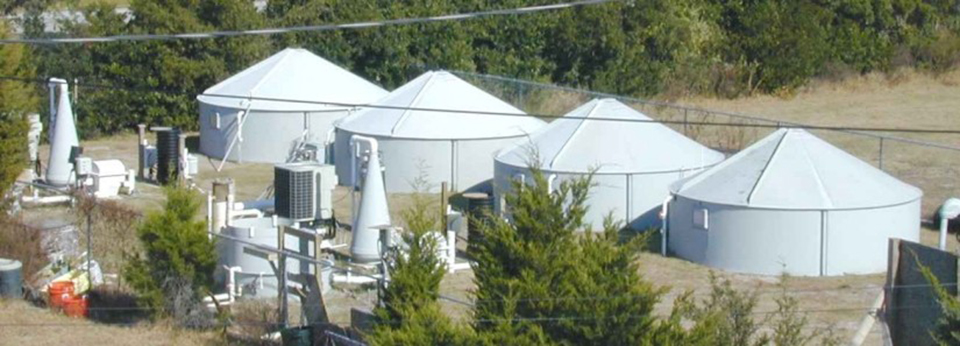
Three facility model sizes were constructed – 0.4 hectares (ha), 2.02 ha and 4.04 ha – based on the presumption of economies of scale and facility designs from UNCW and the NCSU fish barn. The optimally sized growout operation was determined to comprise three 0.4-ha facilities, each consisting of 16, 8.23-meter-diameter tanks supported by state-of-the-art recirculating aquaculture system components. Such components include particle trap and swirl separators, drum screen filters, trickling biological filters, ultraviolet sterilizers, heat pumps, protein skimmers, and oxygen cones – all covered in a steel building with a small office and lab.
Since fingerlings are purchased from a single supplier at prices ranging U.S. $1.25 to $2.00 each, depending on quantity, the three 0.4-ha facilities must collectively purchase the quantity of fingerlings needed to receive the minimum price.
The model assumes the growth rate of the fish in these facilities is similar to the fastest-growing fish from a UNCW flounder growth study. The study found that 5 percent of the fish grew to 681 grams at day 454. The top growers were harvested at day 454 because the study showed little or no growth after that time.
The model also assumes the owner/manager owns three 0.4-ha parcels of coastal land with access to full-strength seawater and operates three, 0.4-ha facilities with a staff of one technician for each facility. The model also takes into account the opportunity cost of owning the land and the owner’s time, in that both could earn income external to the grow-out facility.
Two notable parameters included in the model are the costs of waste removal and fish mortality insurance. Removal of solid waste via a commercial hauler and landfill is U.S. $80 per load per facility, with fish mortality insurance covering disease, mechanical and electrical failure, frost, freeze, and flood at a charge of 4-5 percent of the fish value.
Production parameters

Fingerlings of 10 grams mean weight are initially stocked into four of the 16 grow-out tanks at a density of 4.6 kg animals per cubic meter. They are transferred to eight tanks at day 40, with the biomass split evenly among the tanks. Then the fish are transferred to 12 tanks at day 150, with the biomass again distributed among the tanks. The model utilizes all 16 tanks on day 250 and grows the fish to a final mean weight of 681 grams in 454 days.
The stocking schedule saves electricity by not running the full system when the tanks are not at full capacity. It also saves unnecessary wear on equipment and reduces the maintenance of tanks. Fish are fed a commercial pelleted diet that costs U.S. $0.66 per kilogram, and the feed-conversion ratio is 1.5. Final harvest density is 61 kilogram per cubic meter with a total harvestable weight of 49,091 kilogram per cycle per facility.
Costs and returns
Fish are harvested in April, when summer flounder prices are highest. Under the base case scenario, break-even price is U.S. $6.60 per kilogram, with total costs of $323,690 per cycle. Assuming a sale price of $11.00 per kilogram, the average sale price received by an existing ongrowing flounder operation in North Carolina, the return to management before taxes is $87,575 per cycle per hectare.
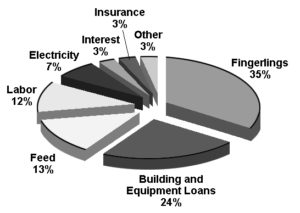
Fingerling costs, building and equipment loans, and labor expenses account for 35 percent, 24 percent, and 12 percent, respectively, of the total costs per cycle (Fig. 1). Unlike many finfish production systems, feed only makes up about 13 percent of the production costs.
The sensitivity of the break-even price to a 5 percent change in each of several key model parameters was examined. Results indicated the break-even price is most sensitive to changes in growth rates and fingerling costs, which can reduce the break-even price U.S. $0.07 and $0.06, respectively. Changes in equipment costs showed a $0.03 decrease in break-even price (Table 1).
Yates, Sensitivity analysis of break-even price response, Table 1
| Parameter Change (%) | Electric Costs | Feed Costs | Equipment Costs | Fingerling Costs | Growth Cycle |
|---|---|---|---|---|---|
| Baseline | $0.51/kw | $0.30/lb | $472,621 | $1.25/fingerling | 13.4 month |
| 5% | $0.01 | $0.02 | $0.03 | $0.06 | $0.07 |
Further profitability
Increasing biological growth rates through selective breeding and/or monosex female culture, and promoting competition and reduced costs in the production of fingerlings appear to be the most promising means of increasing the potential profitability of summer flounder aquaculture. With additional research, the authors consider these goals realistic.
(Editor’s Note: This article was originally published in the June 2004 print edition of the Global Aquaculture Advocate.)
Now that you've finished reading the article ...
… we hope you’ll consider supporting our mission to document the evolution of the global aquaculture industry and share our vast network of contributors’ expansive knowledge every week.
By becoming a Global Seafood Alliance member, you’re ensuring that all of the pre-competitive work we do through member benefits, resources and events can continue. Individual membership costs just $50 a year. GSA individual and corporate members receive complimentary access to a series of GOAL virtual events beginning in April. Join now.
Not a GSA member? Join us.
Authors
-
J. Kevin Yates
The University of North Carolina at Wilmington
Center For Marine Science
7205 Wrightsville Avenue
Wilmington, North Carolina 28403 USA[108,105,109,46,121,109,114,97,46,101,99,97,115,117,46,50,48,119,97,115,64,115,101,116,97,121,46,107,46,104,112,101,115,111,106]
-
Christopher F. Dumas, Ph.D.
The University of North Carolina at Wilmington
Center For Marine Science
7205 Wrightsville Avenue
Wilmington, North Carolina 28403 USA -
Wade O. Watanabe, Ph.D.
The University of North Carolina at Wilmington
Center For Marine Science
7205 Wrightsville Avenue
Wilmington, North Carolina 28403 USA -
Patrick M. Carroll
The University of North Carolina at Wilmington
Center For Marine Science
7205 Wrightsville Avenue
Wilmington, North Carolina 28403 USA -

Thomas M. Losordo, Ph.D.
Department of Biological and Agricultural Engineering
North Carolina State University
Raleigh, North Carolina, USA
Tagged With
Related Posts

Health & Welfare
Dietary organic acids improve gut health, disease resistance in olive flounder
A study evaluated the effects of two organic acid blends on performance, gut health and disease resistance in olive flounder. The dietary organic acids were effective in lowering total gut bacterial counts, gut Vibrio counts and in conferring resistance against Edwardsiella tarda.

Health & Welfare
Korean researchers study protein levels, P:E ratios in olive flounder diets
The authors conducted research to determine the optimum dietary protein levels and protein:energy ratios for different age groups of olive flounders.

Health & Welfare
Advances in fish hatchery management
Advances in fish hatchery management – particularly in the areas of brood management and induced spawning – have helped establish aquaculture for multiple species.

Intelligence
Bahamas venture focuses on grouper, other high-value marine fish
A new venture under development in the Bahamas will capitalize on Tropic Seafood’s established logistics and infrastructure to diversify its operations from processing and selling wild fisheries products to include the culture of grouper and other marine fish.


