Burgeoning industry recovering, future holds potential

Shrimp farming in Brazil began in the 1980s with an initial basis on imported technological models. A learning period of intense validations and enhancements resulted in appropriate technology for local conditions, which in turn contributed to raising Brazil to the position of world leader in productivity in 2003.
Although in 2008 it used only 3.3 percent (19,715 ha) of its farming potential, shrimp farming is a firmly established activity that has demonstrated its technical, economic, social and environmental viability while actively contributing to the alleviation of rural poverty through the generation of business opportunities, income, foreign exchange and the creation of permanent jobs.
Production cycle
The Brazilian shrimp-farming sector works with Pacific white shrimp, Litopenaeus vannamei. The major difference between farmed and wild-captured shrimp relates to the high degree of predictability of production of farmed shrimp and the ability to identify and correct problems that may occur during the production cycle.
Maturation, hatcheries
In Brazil every nauplius, the first larval stage of marine shrimp, comes from a maturation unit, where broodstock are kept under special conditions such as controlled photoperiod. Density of 80-100 shrimp/tank is maintained with an even ratio of males to females. Water exchange and aeration are employed, and feeding takes place six times daily.
As a result of the natural mating process, 10 to 12 percent of stocked females are ready to spawn on a daily basis. They are transferred to a special spawning tank, where eggs are immediately washed and treated against bacteria and fungi, and stocked in tanks. The eggs are kept under heavy aeration until they hatch into nauplii. These nauplii are then concentrated, washed, counted and transferred to hatchery tanks.
During the hatchery stage, larvae receive special care concerning feeding, temperature and oxygen levels, and water quality is maintained so they can overcome the challenges that arise from the various metamorphoses that take place.
Feeding starts at the zoea I stage and is based on microalgae complemented with Artemia salina nauplii and microencapsulated feed. After 18 to 20 days in the hatchery, postlarvae at the PL10 stage are concentrated, counted and placed into plastic bags or special tanks that contain water, oxygen and Artemia nauplii for shipping by land or air to shrimp farms.
Nursery tanks
The use of nursery tanks improves the acclimation process of the postlarvae, allowing them to further develop and become stronger before the pond growout stage. During the 10- to 15-day acclimation period, postlarvae stocked at a density of 20-30 postlarvae/L are kept under constant aeration with feeding at two-hour intervals. Proper management techniques, together with the use of appropriate feeds, result in an average survival rate of around 90 percent.
Besides this system, some farms also use the hapa system, incorporating hapa pens of about 10 percent of the pond area wihtin the ponds. Postlarvae (P.L.) from the hatcheries or nursery tanks are kept for 10 to 15 days and then released into the ponds.
Grow-out ponds
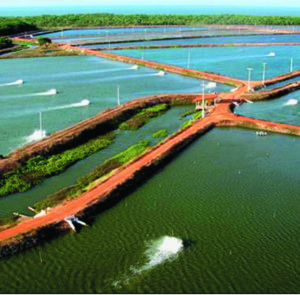
Prior to stocking, growout ponds undergo a sterilization process to eliminate opportunistic pathogens and predators. They also undergo preparations that eliminate metabolites, reduce organic matter, increase pH and promote the development of bacterial communities. After these steps, the ponds are filled with previously filtered water and stocked at 20-70 P.L./m².
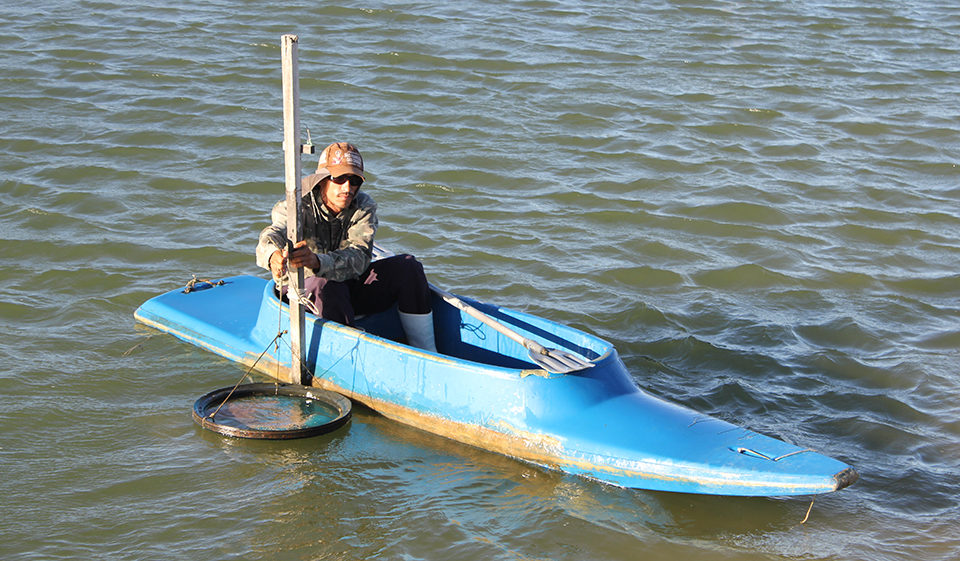
In the growout phase, shrimp reach commercial sizes of 7 to 25 g. During this 70- to 150-day period, shrimp are fed two to four times daily using pelleted feed distributed from fixed trays by workers in kayaks. The leftover feed is routinely checked and removed, thus avoiding its degradation, which can cause stress and adversely impact the growout environment.
Moreover, control of physical and chemical parameters such as temperature, dissolved oxygen, salinity, pH, nitrite and ammonia levels, and the biological parameters phytoplankton, zooplankton and zoobenthos allows the adoption of corrective measures that ensure an ecologically balanced environment. In addition, the use of probiotics as a biosecurity tool as well as nutritional control is becoming part of the management routine of hatcheries, nursery tanks and grow-out ponds.
Weekly biometrics and presumptive analysis generate information on shrimp performance as well as corrective or preventive measures during the growout process. Depending on these analyses, the harvesting process may begin, preferably at nighttime due to the movement of the shrimp and the milder temperatures, reducing stress and improving the final quality of the shrimp.
Harvesting is done manually with bag nets or by machines placed on the backs of the flood gates. The harvested shrimp are placed in plastic containers and immersed in a solution of water, ice and sodium metabisulfite. After this treatment, they are placed in boxes with ice and transported by insulated trucks to the processing plant or packed in insulated boxes containing ice to be sold fresh to local markets.
Processing
Once the shrimp arrive at the processing plant, samples are taken and submitted to sensorial and quality analyses to ensure that they comply with the standards set forth by Brazil’s Health Authority. The shrimp are immediately stored in holding chambers at minus-5 degrees-C to preserve their characteristics and natural freshness.
Once they are released for processing, they go through an ice separator containing hyperchlorinated ice water, where they are mechanically sorted and transported via a nylon conveyor belt to the washing and inspection platform. Foreign materials and damaged shrimp are removed there.
After this process, shrimp are transferred via conveyor belt to a mechanical grader with six chutes, each corresponding to a size classification established by national and international standards. They are then weighed, packed in small boxes and placed in freezing tunnels.
The frozen blocks are removed from the freezing shelves, packed in master boxes and stored in cold chambers according to type, classification, product lot and date of manufacture. Afterwards, depending on commercial demand, the shrimp are removed from the storage chambers and shipped by land or sea to consuming centers in Brazil and abroad.
Socioeconomic, environmental impacts
The farmed shrimp agribusiness has taken on increasing social importance in Brazil, especially in the northeastern region of the country, which accounts for 95 percent of national production. This region has 1,200 shrimp farmers with 19,715 hectares (ha) of ponds, which created 50,000 jobs that produced 65,000 metric tons (MT) of shrimp worth $300 million in 2009. Shrimp aquaculture creates more direct and indirect jobs than the country’s fruit production industries.
In a 2005 study, Dr. Luis Andre Sampaio and fellow researchers analyzed the socioeconomic impacts of shrimp farming in the 10 most important farming municipalities in the region. Shrimp farming provided 63 percent and 91 percent of all formal jobs in Jandaíra and Cajueiro da Praia, respectively. The sector’s share of tax revenue contributions in the states of Porto do Mangue, Cajueiro da Praia and Jandaíra was 58.2, 30.0 and 25.6 percent, respectively (Table 1).
Rocha, Shrimp farming contributions, Table 1
| Municipality | Economically Active Population | Total Jobs Created By Shrimp Farming | % of Economically Active Population | Shrimp-Farming Jobs (%) | Tax Revenues (%) |
|---|
Municipality | Economically Active Population | Total Jobs Created By Shrimp Farming | % of Economically Active Population | Shrimp-Farming Jobs (%) | Tax Revenues (%) |
|---|---|---|---|---|---|
| Cajueiro da Praia | 3,559 | 442 | 12.4 | 91 | 30.0 |
| Acarau | 27,240 | 1,831 | 6.7 | 13 | 10.1 |
| Aracati | 37,376 | 3,657 | 9.8 | 22 | 1.7 |
| Canguaretama | 15,103 | 1,935 | 12.8 | 20 | ND |
| Pendencias | 7,010 | 2,169 | 30.9 | 48 | 14.5 |
| Porto do Mangue | 2,393 | 825 | 34.5 | 33 | 58.2 |
| Goiania | 44,980 | 629 | 1.4 | 6 | 3.3 |
| Ipissuma | 12,359 | 325 | 2.6 | 11 | 2.8 |
| Valença | 47,409 | 995 | 2.1 | 13 | 3.3 |
| Jandaíra | 5,427 | 583 | 10.7 | 63 | 25.6 |
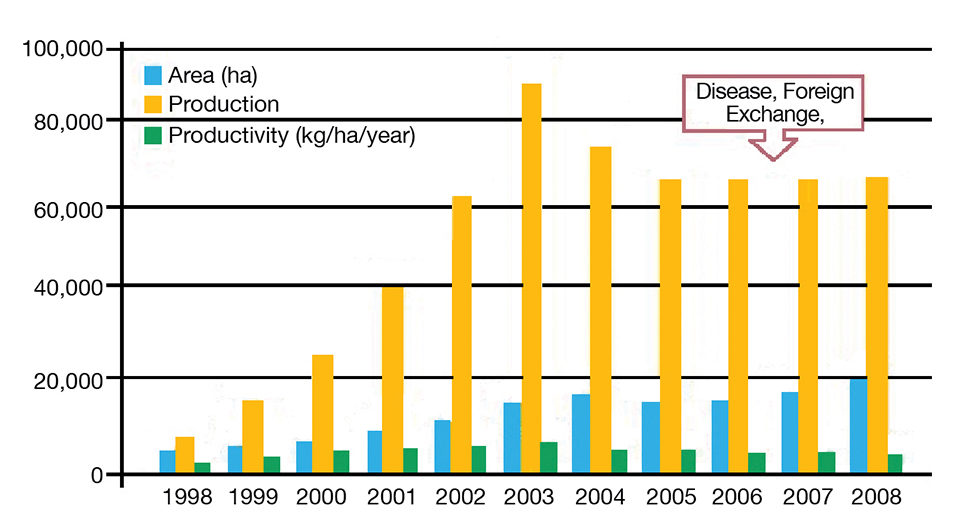
If explored in an efficient manner based on average national productivity, Brazil can reach a prominent position in terms of global production, for it has 600,000 ha of suitable area with excellent natural conditions and infrastructure, and a large and promising internal market to lead this growth. This potential can be illustrated by the evolution of Brazil’s production and export performance, which grew from 7,260 MT and $2.8 million in 1998 to 58,455 MT and $235.9 million in exports, respectively, in 2003 (Fig. 1).

Environmental sustainability
Throughout the years, Brazilian marine shrimp farming has used sound management practices based on technical, social and environmental criteria that ensure a harmonious coexistence with a balanced environment. A number of researchers analyzed and identified the main vectors and human actions that stress, pollute and impact rivers and estuaries in Brazil. They demystified and proved wrong the dogmas of the more radical environmentalists who attributed to shrimp farming negative effects on water quality and the integrity of the biodiversity of environments adjacent to shrimp farms.
Moreover, a 2004 study by Madrid concluded: “In general, statistically speaking, pond water in microbiological terms is cleaner than the water supply of the farms, which leads one to deduce that shrimp ponds act as stabilization and purification pools for effluents. The contamination of total coliforms and fecal coliforms in pond waters was reduced by 30 and 35 percent, respectively, when compared to supply waters.
In addition, an important study on mangrove areas that analyzed a 26-year (1978-2004) interval in the main shrimp-producing states in Brazil’s northeast showed a 36.56 percent increase in mangrove area – which went against the claims that shrimp farming destroys mangroves.

Opportunities, constraints
Despite the development that took place before 2003, in 2004, Brazilian shrimp farming faced challenges that affected its overall growth. Between 2003 and 2008, there were significant reductions in production, which decreased from 90,190 to 65,000 MT (27.9 percent), and productivity, which went from 6,084 to 3,297 kg/ha/year (45.9 percent). Exports decreased almost 84 percent during the period, from 58,455 to 9,398 MT.
The problems faced by the sector were aggravated by the lack of official support and incentives to help the shrimp aquaculture industry overcome its difficulties and compete on an equal footing at the international level.
Shrimp farming overcame by its own efforts the serious problems caused by infectious myonecrosis and heavy floods in 2004, and the loss of export competitiveness due to the sharp devaluation of the U.S. dollar. The recovery was based on the adoption of appropriate management techniques and the expansion of the internal market. Survival rates have returned to levels seen prior to 2004, and the internal market absorbed 93 percent of the farmed shrimp production in 2009.
(Editor’s Note: This article was originally published in the September/October 2010 print edition of the Global Aquaculture Advocate.)
Now that you've finished reading the article ...
… we hope you’ll consider supporting our mission to document the evolution of the global aquaculture industry and share our vast network of contributors’ expansive knowledge every week.
By becoming a Global Seafood Alliance member, you’re ensuring that all of the pre-competitive work we do through member benefits, resources and events can continue. Individual membership costs just $50 a year. GSA individual and corporate members receive complimentary access to a series of GOAL virtual events beginning in April. Join now.
Not a GSA member? Join us.
Author
-

Itamar de Paiva Rocha
President
Associação Brasileira de Criadores de Camarão
Rua D. Maria Carolina
205/sala 104 – Boa Viagem
Recife – P.E., CEP-51020-220 Brazil
Tagged With
Related Posts

Responsibility
A look at various intensive shrimp farming systems in Asia
The impact of diseases led some Asian shrimp farming countries to develop biofloc and recirculation aquaculture system (RAS) production technologies. Treating incoming water for culture operations and wastewater treatment are biosecurity measures for disease prevention and control.

Health & Welfare
A case for better shrimp nutrition
Shrimp farm performance can often be below realistic production standards. Use proven nutrition, feeds and feeding techniques to improve profitability.

Responsibility
A look at integrated multi-trophic aquaculture
In integrated multi-trophic aquaculture, farmers combine the cultivation of fed species such as finfish or shrimp with extractive seaweeds, aquatic plants and shellfish and other invertebrates that recapture organic and inorganic particulate nutrients for their growth.

Intelligence
A motive, and a market, for farmed fish in Mexico
Boasting ample areas for aquaculture and a robust domestic demand for seafood – not to mention its close proximity to the U.S. market – a land of opportunity lies in Mexico. Fish farming is primed to meet its potential south of the border.

