Projected CAGR of 5.4 percent for 2017 to 2021
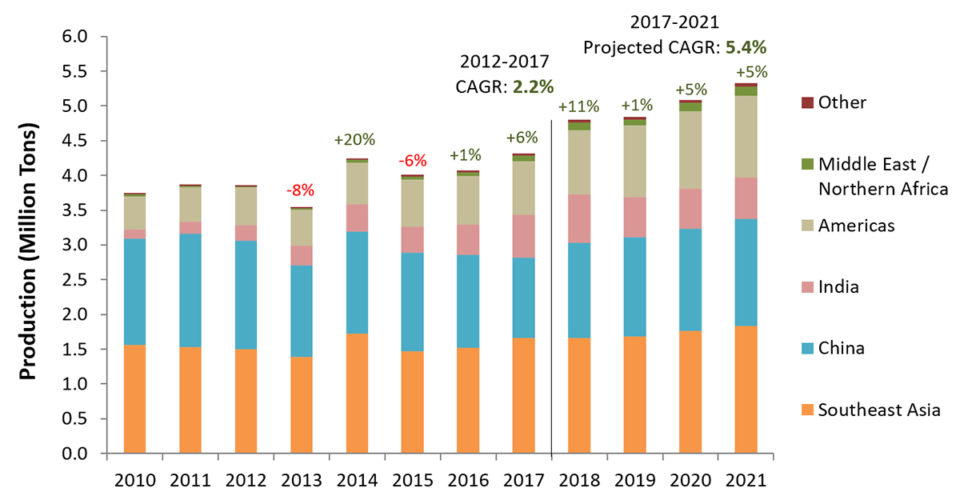
The Global Aquaculture Alliance’s GOAL (Global Outlook for Aquaculture Leadership) 2019 survey of production trends in shrimp farming polled industry participants in Asia/Oceania (43 responses), Latin America (39 responses) and Africa (two responses). Fig. 1 summarizes the production estimates for global production from 2010 to 2021. The data from 2010 to 2017 represent a mix of FAO (2019) and GOAL survey (2011 to 2018) estimates, whereas 2018 to 2021 data were obtained from the 2019 GOAL survey.
Based on the previous GOAL surveys, the industry showed signs of recovery in 2016 and 2017, resulting in a CAGR of 2.2 percent for the period 2012 to 2017 – much lower than the 6.3 percent rate estimated by the Food and Agriculture Organization of the United Nations (FAO). GOAL respondents reported a surge in production in 2018 (+11 percent compared to 2017) and expect to see further growth through 2021.
It should be noted that the current FAO data for shrimp production in China have been revised downwards every year from 2009 to 2016. The change has shifted China’s shrimp production estimates lower by about 100,000 metric tons (MT) in most of those years. Despite this adjustment, the discrepancy between FAO and GOAL datasets remains, but it is narrower.
Asia
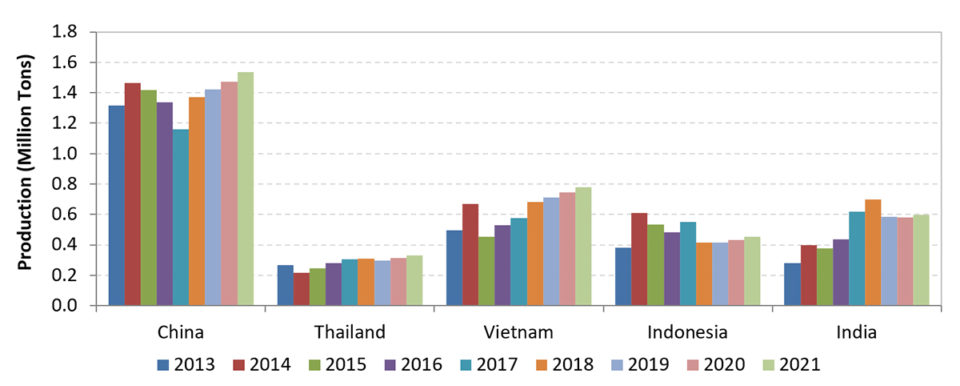
According to the GOAL survey, production has recovered since 2015, reaching 3.75 million MT in 2018 and potentially 4.00 million MT in 2021. Growth will be stronger in Vietnam and China, with predicted CAGRs of 4.6 and 3.9 percent from 2018 to 2021, respectively.
Respondents from India and Indonesia expect to see much less growth in their countries: Indonesia expects to produce 450,000 MT in 2021, i.e., 18 percent less than the output reported in 2017. India reached a historic production level of 700,000 MT in 2018 but expects output to fall to 600,000 MT by 2021. Thailand should continue to recover from the impact of AHPND/EMS, albeit at a slow pace: production is expected to reach 330,000 MT in 2021, amounting to only 56 percent of the 2010 (pre-EMS) harvest.
Latin America
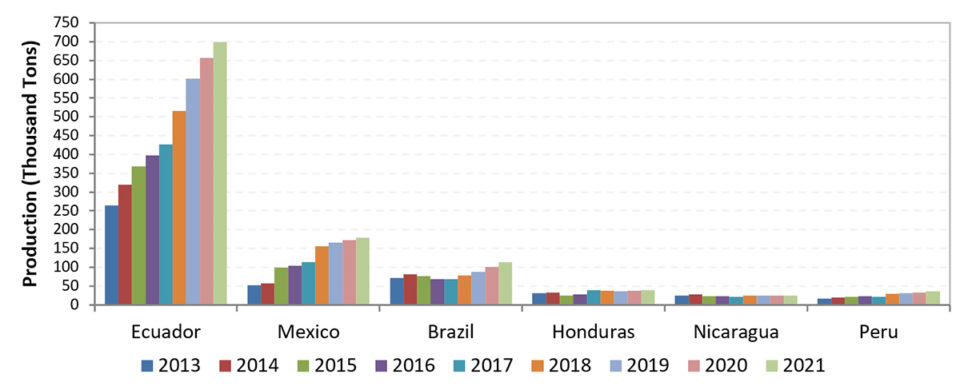
Fig. 3 presents estimates for the major producing nations in Latin America. The most important development in the region is the spectacular growth of the Ecuadorian shrimp farming industry. Ecuador has fully taken advantage of the pervasive disease crisis in Asia to increase exports to European and Asian markets. Production is expected to reach 700,000 MT in 2021, with a CAGR of 11.3 percent between 2015 and 2020. This growth would make Ecuador the third largest producer in the world after China and Vietnam. Ecuador will continue to account for more than half of the farmed shrimp supply in the Western Hemisphere.
Although Mexico withstood severe losses in 2013, the industry was able to restore production by 2015. Further growth is expected, with harvests reaching 180,000 MT in 2021 (CAGR of 10.4 percent during 2015 to 2021). Growth is also predicted in Brazil, with production exceeding 110,000 MT in 2021.
Peru, Venezuela and Guatemala also reported positive expectations for growth through 2021; in contrast, much less growth is expected in Honduras, Nicaragua, Panama and Colombia. Overall, the region produced 920,000 MT in 2018 and expects to reach 1.18 million tons in 2021 (CAGR of 6.5 percent for 2018 to 2021).
Product form trends
The GOAL survey also collects information on trends in size categories and product forms. A recent and notable trend in Asia is the increase of green shrimp relative to other product forms such as peeled. While head-on and head-off green shrimp accounted for only 25 percent of production in the 2008 survey, it accounted for 45 percent in the most recent poll. These changes suggest a growing importance of the domestic Chinese market, which has a preference for green shrimp.
Production in Latin America continues to be oriented towards green shrimp. Head-on shrimp has become the dominant product form over head-off shrimp. It accounted for 55 percent of production in 2018, up from 40 percent in 2007. Increased shipments of Ecuadorian shrimp to European and Asian markets are an important factor driving this trend.
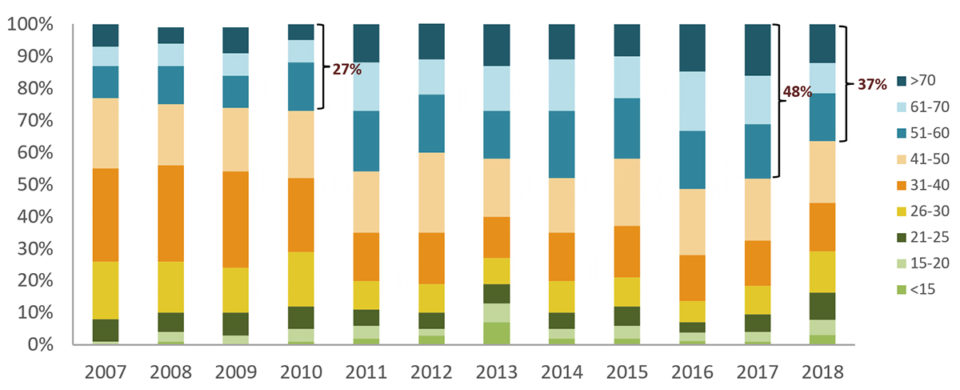
Respondents in Asia have reported a move towards production of smaller shrimp sizes (51-60 and smaller) since 2011 (Fig. 4). The share of small counts increased from 27 percent in 2010 to 48 percent in 2017. Early harvests caused by EMS and other diseases is a likely driver of this trend. The share of small counts decreased to 37 percent in the most recent survey, but it remains higher than the small-count shares reported prior to 2011.
Issues and challenges
Once again, “diseases” was clearly identified by Asian respondents as the top challenge faced by the industry. “Feed costs” and “access to disease-free broodstock” were ranked as the second- and third-most pressing issues, respectively. “International trade barriers” came close in fourth place (up from eight place in the 2018 survey), probably reflecting increased concerns about the ongoing trade disputes between the United States and China. “Market prices” was ranked as the seventh-most important issue.
In contrast, Latin American respondents singled out “market prices” as the most important issue in shrimp farming, with “feed costs” and “fuel costs” emerging as the second- and third-most pressing issues. “International trade barriers” was ranked fourth (up from the fifth position in the 2018 survey). “Diseases” dropped to seventh place, after being consistently ranked as a top three issue in the most recent years.
The rankings provided by Latin American respondents in the 2019 survey are similar to those reported in the 2007 survey, when producers used to be more concerned about market prices, feed costs and trade barriers as opposed to diseases. Disease management and production practices in the region have apparently calmed fears about emerging pathogens. In Asia, “diseases” clearly remains the most pressing issue given the strong impact of EMS and new, emerging diseases in countries such as India.
On average, Asian respondents tended to be more optimistic than producers from other countries about global economic conditions and the strength of the shrimp market in 2020. Greater agreement was found across countries regarding feed prices, which will continue to experience upward pressure in 2020.
Now that you've finished reading the article ...
… we hope you’ll consider supporting our mission to document the evolution of the global aquaculture industry and share our vast network of contributors’ expansive knowledge every week.
By becoming a Global Seafood Alliance member, you’re ensuring that all of the pre-competitive work we do through member benefits, resources and events can continue. Individual membership costs just $50 a year. GSA individual and corporate members receive complimentary access to a series of GOAL virtual events beginning in April. Join now.
Not a GSA member? Join us.
Authors
-

James L. Anderson, Ph.D.
Director, Institute for Sustainable Food Systems
Professor, Food and Resource Economics
University of Florida -

Diego Valderrama, Ph.D.
Assistant Professor, Department of Environmental Science and Policy
George Mason University -

Darryl E. Jory, Ph.D.
Editor Emeritus
Global Aquaculture Alliance
Related Posts

Intelligence
10 takeaways from GOAL 2019 in Chennai, India
The Global Aquaculture Alliance held its GOAL conference in Chennai, India, and recruited a host of experts in various fields to share their expertise.

Intelligence
Global shrimp survey: GOAL 2016
The GOAL 2016 global shrimp production survey showed a strong rebound in 2014 (up 10 percent to 4.18 MMT), followed by a decline in 2015 (down 5.4 percent) and another recovery forecast for the next three years. Global production is expected to reach around 4.44 MMT in 2018, barring a new disease crisis.

Intelligence
GOAL 2017: Global shrimp production review and forecast
The GOAL 2017 production survey for global shrimp farming production showed a minor recovery for 2016, with production expected to strengthen through 2019, when global farmed production should reach 4.82 million metric tons (MMT), barring major shrimp disease issues.

Intelligence
How we can help children reach for seafood
Seafood has many health benefits for the young and the not-so young alike. Educating the next generation of consumers – as children – and their parents about healthier lifestyle decisions must be a priority for everyone in the seafood business.

