Even low inclusion rates improve feed efficiency for juvenile whiteleg shrimp reared in high salinities

Commercial shrimp feeds are going through major shifts in their ingredient composition, particularly regarding the sources of protein traditionally used. The inclusion of fishmeal derived from pelagic fish, such as the anchovy, has generally been drastically reduced over recent years.
This has resulted in more widely available and cheaper ingredient sources, including those from processing waste meals obtained from fisheries and aquaculture (tuna, tilapia, sardines, salmon, pangasius), agriculture meals and concentrates (soybean, canola, corn, rice, pea) and rendered animal byproduct meals (poultry byproduct, hydrolyzed feather, spray-dried blood, meat and bone). Feeds containing these alternative ingredients can perform effectively, if the correct supplementation with minerals, synthetic amino acids and feeding stimulants is carried out.
Past work has shown that low inclusions of krill meal counteract the effects of fishmeal-challenged diets for juvenile whiteleg shrimp (Litopenaeus vannamei). Suresh et al. (2011) formulated zero-fishmeal feeds with 20 percent poultry meal. Feeds that contained 3 percent krill meal significantly improved feed attractability, palatability and shrimp growth. Sá et al. (2013) working with a SPC-based feed with only 5.0 percent fishmeal, found that a combination of whole squid meal and krill meal starting at 0.5 percent enhanced shrimp final weight; with a greater effect at 2 percent inclusion. Sabry-Neto et al. (2016) working with all-plant protein diets, reported that only 1 percent krill meal could enhance shrimp feed intake. At 2 percent, there was an acceleration of growth, increase in yield and a reduction in FCR. Derby et al. (2016) reported that krill meal increases feed palatability by prolonging the feeding bout and the amount of feed eaten.
The present study aimed at investigating if low doses of krill meal can improve whiteleg shrimp growth and feed efficiency under high salinity culture, when fishmeal levels are challenged. This article is adapted from Aqua Culture Asia Pacific 13(6), November/December 2017.
Experiment setup
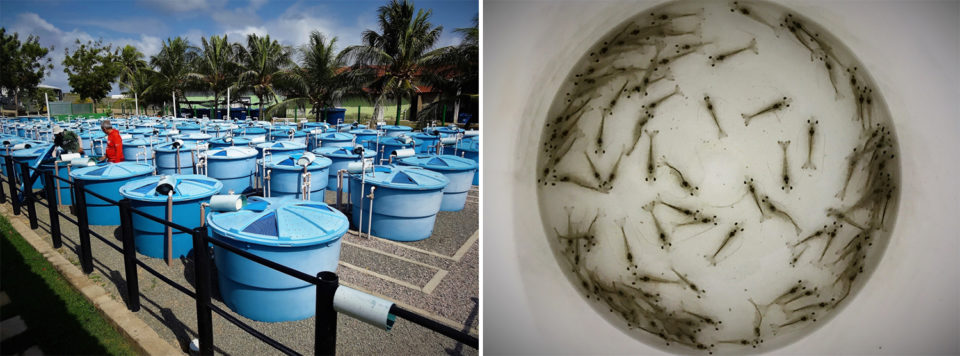
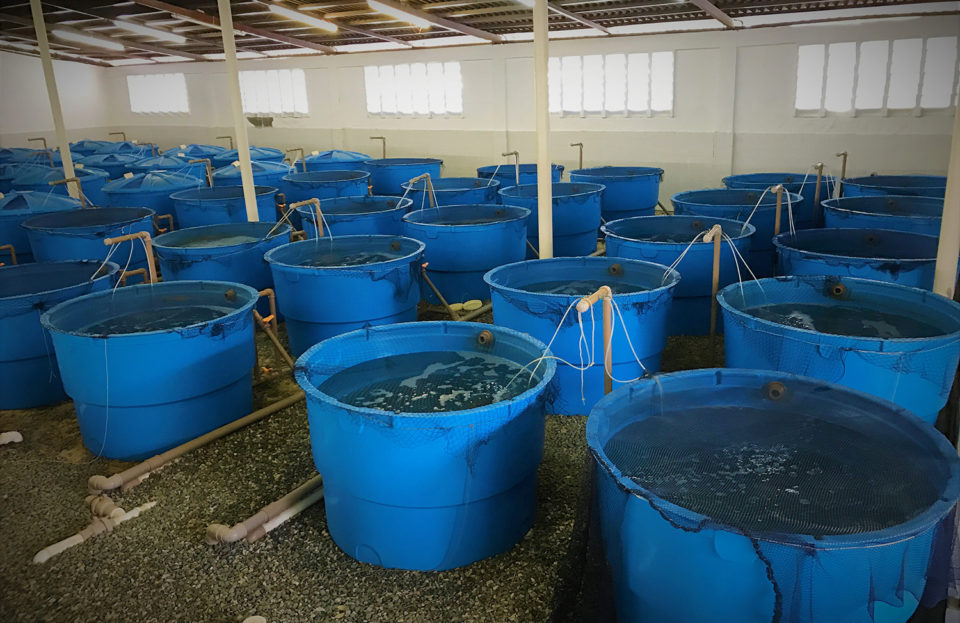
This study was carried out at the LABOMAR aquaculture facilities in northeastern Brazil. Specific-pathogen free (SPR) shrimp of 1.13 ± 0.19 grams were stocked in 30 outdoor tanks of 1 cubic meter under 100 animals per square meter and raised for 71 days (Fig. 1). Shrimp were fed four lab-made feeds using an automatic feeding device that operated four to 10 times a day between 7 a.m. and 5 p.m. Feeds were adjusted bi-weekly by sampling and weighing individually five shrimp per rearing tank.

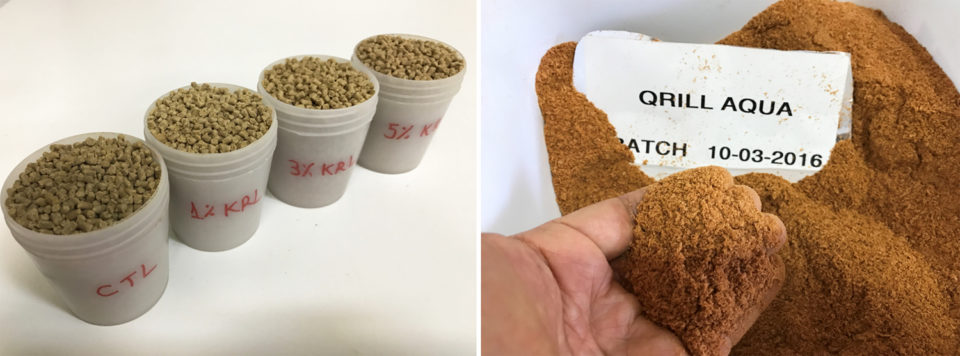
A control (CTL) feed was formulated to contain 15 percent fishmeal with 1 percent squid meal (Fig. 2, Table 1). From the CTL, three other feeds were prepared by reducing fishmeal by half and supplementing 1, 3 and 5 percent krill meal (Qrill™ Antarctic krill meal, Aker BioMarine Antarctic AS, Oslo, Norway).
Feeds were formulated to be nearly similar in their nutrient composition. Dietary crude protein and total lipids reached means (± standard deviation) of 38.4 ± 0.53 and 9.2 ± 0.16 percent (dry matter basis), respectively. Dietary methionine showed the greatest variation among analyzed essential amino acids (EAA) with a mean of 0.64 ± 0.05 percent. All other EAA fell within recommended levels for farm-raised shrimp. With the reduction of fishmeal level, formula costs reduced to 19.3, 12.7 and 7.1 percent when the CTL diet is compared with diets with 1, 3 and 5 percent krill meal, respectively.

Nunes, Krill meal, Table 1
| Ingredients | Control Diet | 1% Krill meal | 3% Krill meal | 5% Krill meal |
|---|
Ingredients | Control Diet | 1% Krill meal | 3% Krill meal | 5% Krill meal |
|---|---|---|---|---|
| Soybean meal, 48.8% CP, 1.3% fat | 36.44 | 48.24 | 46.35 | 44.10 |
| Wheat flour, 9.2% CP, 1.3% fat | 30.51 | 25 | 30 | 30.35 |
| Salmon meal, 59.4%, 9.4% | 15 | 7.73 | 7.04 | 7.01 |
| Cassava starch | 3 | 5 | 2.56 | 3 |
| Salmon oil | 3 | 2 | 2 | 2 |
| Lecithin oil | 2.42 | 2.92 | 2.73 | 2.49 |
| Wheat bran, 13.4% CP, 2.8% fat | 2 | 1.39 | 0 | 0 |
| Vital wheat gluten, 78.7% CP, 1,7% fat | 2 | 1 | 1 | 1 |
| Magnesium sulfate | 1.2 | 0.31 | 0 | 0 |
| Vitamin-mineral premix | 1 | 1 | 1 | 1 |
*FOB prices in US dollars, to northeastern Brazil.
**analyzed values, dry matter basis. Source: Nofima Biolab (Fyllingsdalen, Norway).
During shrimp culture, water salinity increased progressively from 32 to 41 g/L, with a mean of 37 ± 1.8 g/L. Water pH and temperature reached 7.6 ± 0.26 (7.0 – 8.3) and 30.5 ± 0.65 (27.7 – 34.1 degrees-C), respectively. Total ammonia nitrogen, nitrite and nitrate averaged 0.38 ± 0.22 (0.20 – 0.71 mg/L), 1.30 ± 1.13 (0.10 – 3.10 mg/L), and 5.78 ± 2.91 (3.00 – 11.00 mg/L), respectively.
At harvest, final shrimp survival (percent), body weight (g), daily growth (g), gained yield (grams per square meter), amount of feed delivered per stocked shrimp (g) and feed conversion ratio (FCR) were calculated for each dietary treatment. To determine potential differences in feed attractability, harvested shrimp were transferred to five indoor tanks of 0.5 m3 and stocked at 40 shrimp/tank (70 shrimp per square meter).
Animals were fed for eight days in excess twice a day. Total meal was equally split between the four feeds and delivered simultaneously in feeding trays positioned opposite to each other in each tank. After 1 hour, trays were removed, and feed left-overs dried in a convection oven. Feed attractability was calculated by estimating the total apparent feed intake (AFI) given on a dry matter basis.

Results and discussion
Final shrimp survival was high reaching an average of 96.2 ± 3.04 percent (Table 2). Survival was unaffected by dietary treatment (P > 0.05). Similarly, no effect on shrimp growth was associated with feed type. Shrimp grew slowly regardless of dietary treatment, at a daily rate of 0.10 ± 0.01 grams. The high-water salinity observed during culture appeared to have impaired growth.
However, shrimp fed the CTL and the feed with 5 percent krill meal achieved statistically higher body weights compared to the other fishmeal-challenged feeds. Since under hypersalinity conditions, there is a high energy expenditure driven by osmoregulation, dietary supplementation of krill meal at 1 and 3 percent was not sufficient to compensate for such a significant reduction in fishmeal levels.
Nunes, Krill meal, Table 2
| Performance | Control Diet | 1% Krill | 3% Krill | 5% Krill |
|---|
Performance | Control Diet | 1% Krill | 3% Krill | 5% Krill |
|---|---|---|---|---|
| Final shrimp survival (%) | 95.1 ± 4.5 | 96.5 ± 2.4 | 96.2 ± 2.6 | 96.9 ± 2.2 |
| Final body weight (g) | 8.14 ± 1.07a | 7.81 ± 1.28b | 7.96 ± 1.15bc | 8.11 ± 1.18ac |
| Daily weight gain (g) | 0.10 ± 0.01 | 0.09 ± 0.01 | 0.10 ± 0.01 | 0.10 ± 0.01 |
| Gained yield (g/m2) | 656 ± 33 | 631 ± 45 | 648 ± 52 | 667 ± 31 |
| Feed delivered (g/shrimp) | 9.57 ± 0.23a | 9.23 ± 0.30a | 8.66 ± 0.29b | 8.64 ± 0.26b |
| Feed Conversion Ratio | 1.46 ± 0.08a | 1.49 ± 0.10a | 1.34 ± 0.09b | 1.30 ± 0.05b |
In our study, although gained shrimp yield progressively increased with higher levels of krill meal, means (650 ± 41 grams per square meter) were not statistically different. However, the amount of feed delivered per stocked shrimp during culture was significantly lower in feeds containing 3 and 5 percent krill meal. This has led to an enhanced FCR for both dietary treatments. Shrimp in the study were able to more efficiently convert dietary protein into growth, when diets contained krill at 3 and 5 percent, despite a reduction of fishmeal by half. Assessment of feed attractiveness has shown that while diets with 1 and 3 percent krill meal were less consumed than the CTL, a 5 percent inclusion of krill meal led to a higher feed intake (Fig. 4). Therefore, an enhancement in shrimp growth and feed efficiency may be partly explained by a higher feed attractiveness.

Perspectives
The present study has shown that under high salinity a reduction in fishmeal by half (from 15 to 7 percent) and of other costly ingredients (squid meal, cholesterol, fish oil) is offset by a 5 percent dietary inclusion of krill meal. Feed efficiency is enhanced starting at a 3 percent dietary inclusion of krill meal even under high salinity conditions. A feed containing 5 percent krill meal and 7 percent fish meal is more palatable than a feed with 15 percent fish meal and 1 percent squid meal. Replacement of fishmeal by krill meal at levels adopted results in a 7 percent savings in formula costs in a grower feed for whiteleg shrimp.
References available from first author.
Authors
-
Dr. Alberto J.P. Nunes
Associate Professor
LABOMAR, Federal University of Ceará, Brazil -
Dr. Hassan Sabry-Neto
Research Fellow
LABOMAR, Federal University of Ceará, Brazil -
Dr. Esaú Aguiar Carvalho
Adjunct Professor
ICTA, Federal University of Western Pará, Brazil -
Dr. Lena Burri
R&D Director of Animal Nutrition and Health
Aker BioMarine, Norway
Tagged With
Related Posts

Aquafeeds
Testing dietary potassium diformate in Pacific white shrimp
Research from experimental trials demonstrate that dietary potassium diformate improves survival, growth and productivity in Pacific white shrimp (Litopenaeus vannamei), including in the presence of the Gram-negative, pathogenic bacterium V. harveyi.

Aquafeeds
Biofloc consumption by Pacific white shrimp postlarvae
The stable isotopes technique with δ13C and δ15N can be used to determine the relevance of different food sources to shrimp feeding during the pre-nursery phase of Litopenaeus vannamei culture. During this trial, different types of commercial feed, microalgae, Artemia sp. nauplii and bioflocs were used as food sources.

Health & Welfare
How good are your shrimp postlarvae?
Stocking the best quality shrimp postlarvae, healthy and free of pathogens, is a critical management step with significant effects on the production and profitability of a shrimp farm.

Innovation & Investment
Artemia, the ‘magic powder’ fueling a multi-billion-dollar industry
Artemia, microscopic brine shrimp used as feed in hatcheries, are the unsung heroes of aquaculture. Experts say artemia is still inspiring innovation more than 50 years after initial commercialization. These creatures are much more than Sea-Monkeys.


