Searching for genetic markers
Selective breeding is a process which strives to select organisms bearing genes for preferred traits such as rapid growth, disease resistance and fecundity. The decision of which offspring to select for the next generation may require that organisms be reared to adulthood or that they be screened using elaborate testing procedures such as disease challenges or reproduction trials. With the advent of “marker-assisted” breeding, the selection process can be greatly accelerated by using genetic markers of observed phenotypic traits to select organisms at a young age without the need for phenotypic screening tests. This can increase the selection intensity and reduce the cost of a selective breeding program.
A prerequisite for marker-assisted breeding is identification of genetic markers for phenotypic traits of interest. The genetic marker need not be the specific gene responsible for a particular phenotypic trait, but it should be linked to it. In practice, this means that the marker is found together with the specific gene when the organism’s DNA is fragmented. This implies that the marker is located in close proximity to the specific gene, or at least on the same chromosome.
The process of searching for markers involves the following steps:
- Fragmenting the DNA using restriction enzymes,
- Amplifying the DNA using PCR technology (PCR is a molecular biology technique that copies DNA fragments, increasing the initial number of fragments millions of times. A detailed explanation of PCR is available in the previous issue of this magazine, Vol. 2, Issue 4/5),
- Loading the DNA at the base of an electrophoretic gel,
- Applying an electric current to the gel to stimulate the negatively charged DNA fragments to migrate toward the positive pole,
- Staining the gel to identify the location of various DNA fragments, and
- Noting the bands created by faster migration of the smaller (lower molecular weight) fragments and slower migration of the larger fragments (Fig. 1).
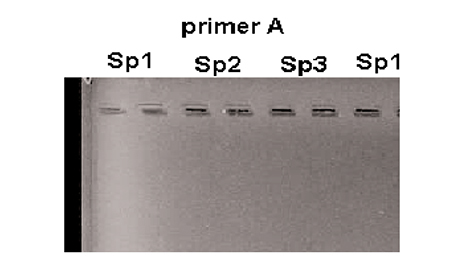
Usually many samples from different animals are run side-by-side on a gel. The vertical bands that form in the gel can be compared among samples. Bands that are common for all samples are called “monomorphic” and bands that are present in some animals but do not exist in others are called “polymorphic.” Polymorphic bands are potential “markers.”
There are many molecular biology techniques useful for finding these markers. The following is a presentation of three methods.
Random amplified polymorphic DNA (RAPD)
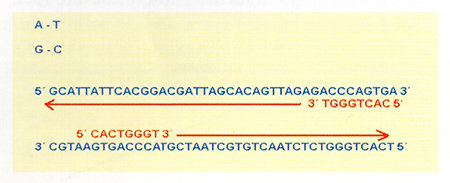
This techniques utilizes a special Polymerase Chain Reaction (PCR) named AP-PCR (arbitrary Primed). RAPD can be run without pre-existing DNA sequence information. Only a single arbitrary primer is used, and the amplified fragments are genoma segments flanked by two complementary primer-binding sites in inverted orientation (Fig. 2). If the binding primer site has a modification in the sequence (mutation, deletion, insertion, etc.), the primer does not bind in this place and will produce a variation in the size of the band.
A set of primers is screened for reproducible polymorphisms. Different primers may identify different polymorphisms and have different reproducibility. Polymorphic bands may be potential genetic markers.
Amplified fragment length polymorphism (AFLP)
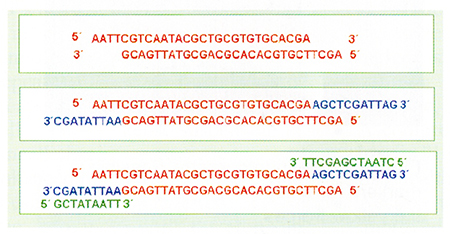
The genomic DNA is digested with two restriction enzymes (restriction enzyme cut double-stranded DNA into specific sequences characteristic to each enzyme). One enzyme can cut a DNA sequence in a few select points, while another enzyme can cut the sequences in more places. Adapters (made of synthetic DNA) are ligated to the “sticky ends” of the genomic DNA, complementary to those of the restriction site (Fig. 3).
This results in the formation of a “hybrid” molecule, adapter-DNA-adapter. Since the sequences of the end fragments are known, we can elaborate primers that anneal (hybridize) to the ends’ fragments. This DNA segment is then used as a template for the PCR reaction. The PCR products are separated on polyacrylamide gels, and the study of the bands is similar to that described in the RAPD technique. This technique, however, produces more bands than the RAPD and its results are more reproducible.
Microsatellites
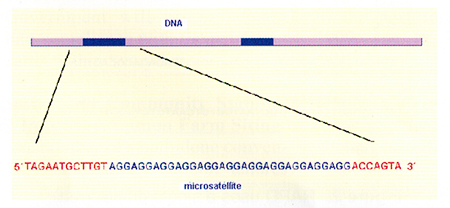
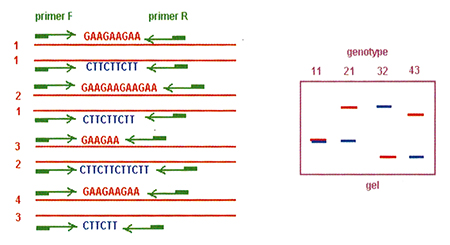
Microsatellites are repeated, non-coding sequences of DNA (do not correspond to genes), and are of variable length. Microsatellite variation can be detected by PCR using primers flanking the repeated DNA sequences (Fig. 4). There are two ways to identify microsatellite loci. One method is by searching through DNA sequence databases for sequences containing simple repeats.
Primers are then designed directly from the sequence data. The second approach is to digest the entire DNA and clone the fragments into a vector. The correct clone is identified using a probe. The DNA fragment is re-isolated from the clone in order to sequence the fragment. With luck, all of the microsatellite sequences with its flanking regions are determined. The primers are designed and the DNA extraction is submitted to the PCR, and then visualized electrophoretically.
Once the microsatellite markers are established, the utility of the marker is high. Fig. 5 shows the variation in the microsatellite sequence and its development in a gel. Different individuals within a given population have the same microsatellite (same sequence repeat), but the length of the sequence is different among these individuals. All posses the same flanking sequences and the specific primers will bind these flanking sites, but the fragment length obtained in the PCR will be different. It is these differences in length (and weight) which generate characteristic patterns of each individual.
From this brief description, it should be apparent that many of these new molecular biology technologies are not for everyone due to their complexity and cost. When embarking on a genetic selection program, it is strongly recommended to consider one or several of these tools. This, however, requires a commitment of both human and material resources in order to make the effort worth while.
(Editor’s Note: This article was originally published in the December 1999 print edition of the Global Aquaculture Advocate.)
Now that you've finished reading the article ...
… we hope you’ll consider supporting our mission to document the evolution of the global aquaculture industry and share our vast network of contributors’ expansive knowledge every week.
By becoming a Global Seafood Alliance member, you’re ensuring that all of the pre-competitive work we do through member benefits, resources and events can continue. Individual membership costs just $50 a year. GSA individual and corporate members receive complimentary access to a series of GOAL virtual events beginning in April. Join now.
Not a GSA member? Join us.
Authors
-
Sam Stern
Desarrollo Industrial Bioacuatico (S.A.)
A subsidiary of Conti Group Co.
Ecuador
-
Leonardo Galli
Desarrollo Industrial Bioacuatico (S.A.)
A subsidiary of Conti Group Co.
Ecuador
Related Posts

Health & Welfare
Antimicrobial resistance: complex, unavoidable
Resistance to antibiotics is unavoidable because it is an aspect of bacterial evolution. Resistant microflora have been observed in water that has not had recent contact with antimicrobial agents.

Intelligence
As ocean temperatures rise, so too will vibrio outbreaks
A study using a half-century of data has linked climate change and warming sea temperatures with an increase in illnesses from the common vibrio bacteria. Shellfish growers, fighting a particularly virulent strain of Vibrio parahaemolyticus, are changing their harvest protocols.

Health & Welfare
Bioinformatics: The ultimate breeding tool
Bioinformatics, a true hybrid between molecular and computer sciences, changes the rules of both breeding and medicine with a novel approach.

Health & Welfare
Microsatellites: Genetic markers of choice
Use of microsatellites is one of many marker approaches, but has proven to be the tool of choice across all commercial agriculture sectors.


