Annual survey data shows farmed fish production increased 73% over past decade

https://commons.wikimedia.org/w/index.php?curid=56504135
The Global Aquaculture Alliance’s annual production survey for key finfish species was presented at the GOAL 2019 conference in Chennai, India in late October. The estimates are based on a global survey of many informants undertaken by GAA, with additional estimates derived from Kontali Analyse AS.
Production figures until 2017 are based much on the Fishstat database operated by the Food and Agriculture Organization of the United Nations (FAO). The Norwegian Seafood Council and the U.S. National Marine Fisheries Service (NMFS) provided data on prices for several species. Table 1 provides a summary of finfish production volumes, with analysis of individual species and trends to follow.
Tveteras, GOAL19 survey, Table 1
| 2017 | 2018 | 2019 | 2020 | 2017-18 | 2018-19 | 2019-20 | Avg. 2010 to 2019 |
|---|
2017 | 2018 | 2019 | 2020 | 2017-18 | 2018-19 | 2019-20 | Avg. 2010 to 2019 | |
|---|---|---|---|---|---|---|---|---|
| Atlantic salmon | 2,290 | 2,423 | 2,599 | 2,689 | 5.8 | 7.3 | 3.5 | 6.1 |
| Coho salmon | 171 | 187 | 203 | 208 | 9.6 | 8.6 | 2.4 | 7.7 |
| Large rainbow trout | 261 | 265 | 300 | 302 | 1.6 | 13.1 | 0.7 | 0.0 |
| Small rainbow trout | 582 | 596 | 610 | 623 | 2.5 | 2.4 | 2.0 | 3.9 |
| Milkfish, selected countries | 857 | 783 | 793 | 804 | -8.6 | 1.3 | 1.4 | 1.8 |
| Barramundi, selected countries | 96 | 90 | 108 | 115 | -6.6 | 19.6 | 6.3 | 10.3 |
| Carps, China | 19,131 | 19,469 | 20,090 | 21,747 | 1.8 | 3.2 | 8.2 | 3.2 |
| Tilapia | 5,881 | 6,276 | 6,513 | 6,800 | 6.7 | 3.8 | 4.4 | 7.7 |
| Catfishes, selected countries | 4,553 | 4,879 | 5,003 | 5,193 | 7.2 | 2.5 | 3.8 | 5.9 |
| Pangasius, Vietnam | 1,249 | 1,422 | 1,468 | 1,506 | 13.8 | 3.3 | 2.6 | 3.5 |
| Sea bass & Sea bream, Mediterranean | 403 | 419 | 412 | 387 | 4.0 | -1.7 | -6.1 | 3.5 |
| Bluefin tuna | 59 | 63 | 72 | 78 | 6.9 | 15.4 | 7.9 | 10.1 |
| Cobia, selected countries | 52 | 51 | 53 | 55 | -0.5 | 2.9 | 4.7 | 5.5 |
| Grouper, selected countries | 161 | 166 | 174 | 185 | 2.7 | 5.1 | 6.3 | 10.9 |
| Corvina, Mediterranean | 25 | 26 | 25 | 24 | 5.0 | -4.0 | -4.0 | 34.2 |
2017 to 2020: production in 1,000 metric tons (MT).
2017-18 to Avg. 2010-19: Percent growth.
Tilapia
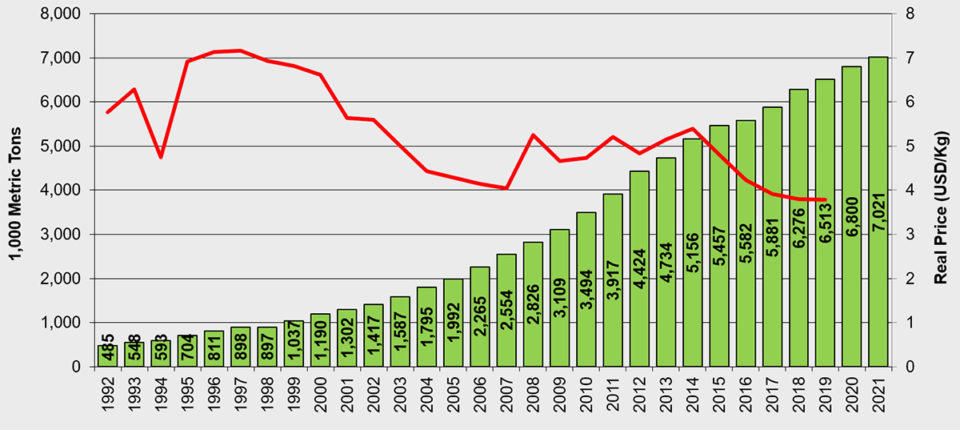
Production of tilapia – the most diversified fish species sector geographically – continues to grow. Production in 2019 is expected to reach 6.5 million metric tons, a 4 percent growth compared to 2018, despite significant disease losses (around 300,000 metric tons, or MT, significantly due to Streptococcus spp. infections) reported for Asia and costing perhaps as much as $500 million in lost value.
Next year, the global production of farmed tilapia is expected to grow by around 4 percent again to 6.8 million MT. This is still significantly lower than the average growth rate over the 10-year period from 2010 to 2019 period, which has been 7.7 percent.
The Global Aquaculture Alliance’s annual global production and forecast surveys for shrimp and finfish are sent to more than 150 sources around the world – to individual industry veterans and to country- and region-wide organizations such as CAPPMA (China Aquatic Products Processing and Marketing Alliance), the Seafood Exporters Association of India, the Norwegian Seafood Council and many others. Some sources provide data for more than one production region, country or species. The data is collected and analyzed by the Global Aquaculture Alliance and its partners and shared each year at GAA’s GOAL (Global Outlook for Aquaculture Leadership) conference.
When we look at a representative price – the U.S. import price for frozen fillets – we find that real prices have fluctuated at levels around $5 per kg since 2008, but started a downward trend in 2014. The price decreased last year to $3.80 per kg, where it remained during the first half of this 2019.
China is the leading global tilapia producer, followed by Egypt and Indonesia. As before, our sources do not agree completely on the production levels of the major producing countries. This year the average estimate from our sources is 1.7 million MT for China, 1.1 million MT for Indonesia and around 900,000 MT for Egypt. For China and Indonesia, production is expected to increase slightly next year, while Egypt’s production is expected to increase by around 10 percent.
Catfishes, including pangasius
China, Vietnam, Indonesia, Bangladesh and India are the largest producers of catfish species. Total production in those countries we cover in our annual survey reached 5 million MT in 2018, 3 percent higher than the previous year. Production is expected to increase by 4 percent to around 5.2 million MT next year.
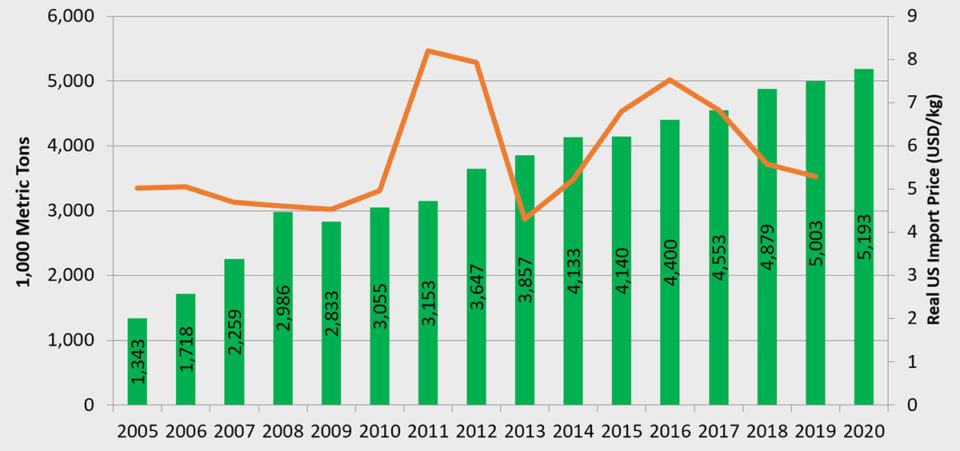
Vietnam is estimated to increase pangasius production by 3 percent from 2018 to 2019, from 1.4 million to 1.5 million MT, and an additional 3 percent in 2020.
Import prices for tilapia products to the United States and the EU had been on a downward trend since 2007, but have recently moved upwards. In the first half of this year, frozen fillet prices averaged $4.30 per kg in the United States and around $3.30 per kg in the European Union.
Carps
Carps are primarily produced for domestic markets, and their production is difficult to estimate. The total estimated production of the various carp species included in our survey is around 28 million MT in 2019, up by around 6 percent from the previous year. Next year production is expected to increase by 7 percent to around 31 million MT. China is by far the dominant producer, with 2019 production expected to increase by 3 percent to 20 million MT. India also produces significant amounts of various carp species.
Atlantic salmon
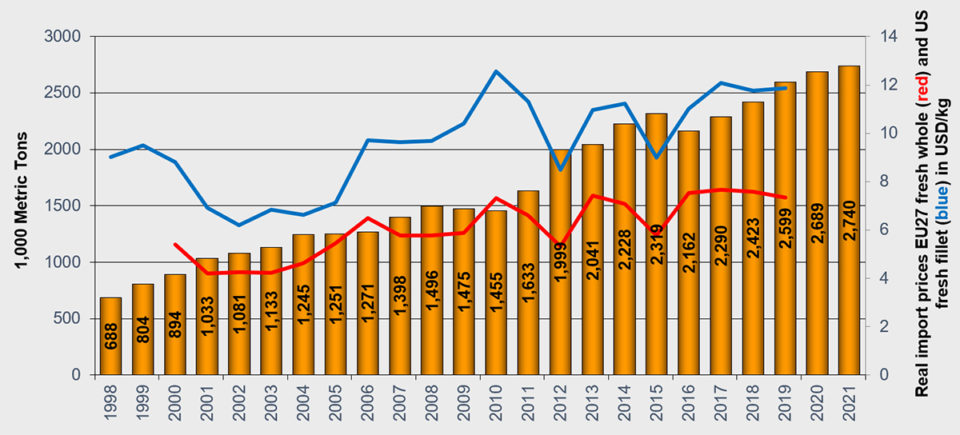
Atlantic salmon is expected to reach a production of 2.6 million MT in 2019, up by 7 percent from 2017. Prices have remained at high levels for the first half of the year, at $11.90 per kg for fresh fillets into the United States and around $7.30 per kg for whole gutted salmon into the EU market (Fig. 3). But we have seen significant downward movement in prices over the last quarter. Next year, production is expected to increase by 3.5 percent to 2.7 million MT.
The main producer of farmed Atlantic salmon, Norway, is estimated to have a production of 1.3 million MT in 2019, while the second-largest producer, Chile, is forecasted to produce 714,000 MT this year.
Trout
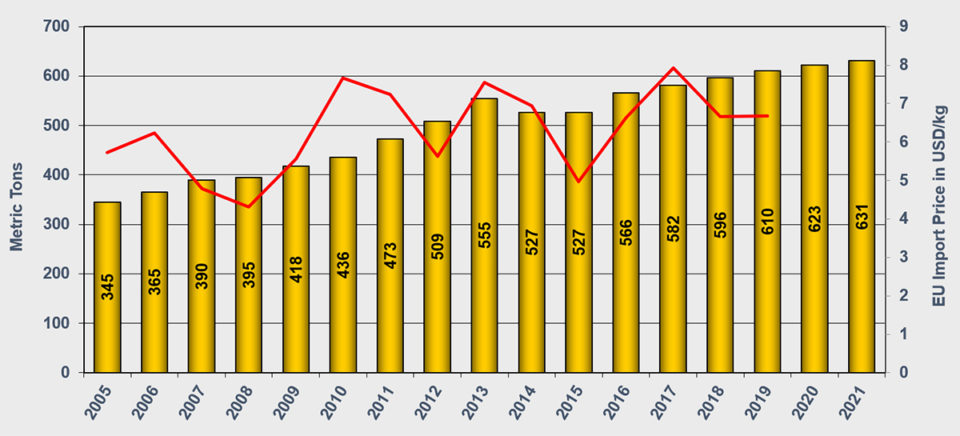
Production of large rainbow trout in marine waters is expected to recover to 300,000 MT this year, 13 percent higher than in 2018, but still below the peak levels of around 2012. Prices have been stable or declining the first half of this year, but the long-run trend has been upwards.
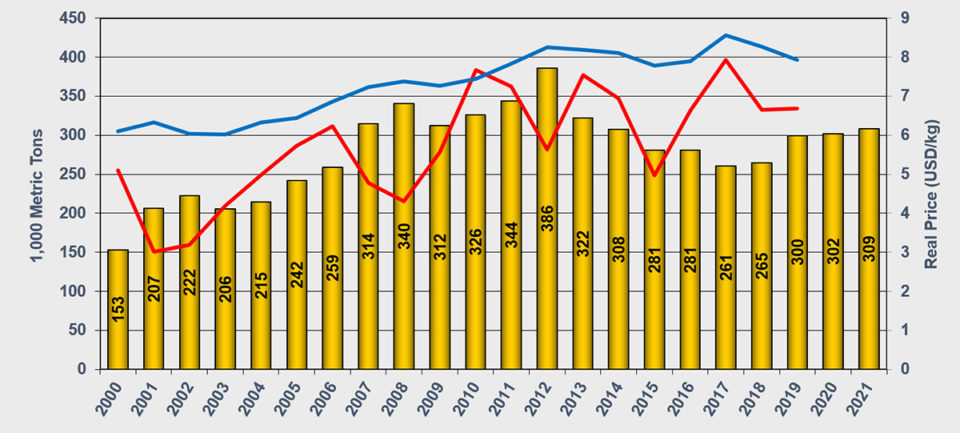
The production of smaller trout, primarily farmed in freshwater, is still on a moderate upward trend. Production is increasing by 2 percent to around 610,000 MT this year. In 2020, production is expected to further increase by 2 percent to 620,000 MT.
Barramundi
Barramundi production for the countries we survey is estimated at 108,000 MT in 2019, up by 20 percent. Next year, the forecast is for an increase of 6 percent to around 115,000 MT.
Sea bass and sea bream
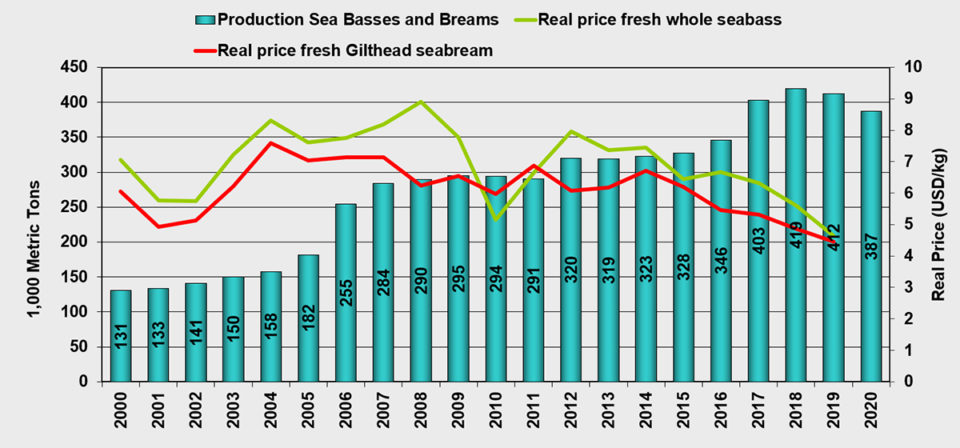
Sea bass and sea bream production in the Mediterranean is estimated to decline this year by 2 percent to around 410,000 MT. Next year, production is expected to decline again, by 6 percent. Sea bass and sea bream do not get much traction from the market. Prices have generally been on a downward trend since 2012, and that has continued this year.
Cobia
Cobia production for the countries we cover – China, Taiwan, Panama and Vietnam – is estimated to be 53,000 MT this year, an increase of 3 percent from the previous year. In 2020, production is expected to increase by 5 percent. Since 2010, production in these countries has fluctuated around levels of 40 to 50,000 MT.
Bluefin tuna
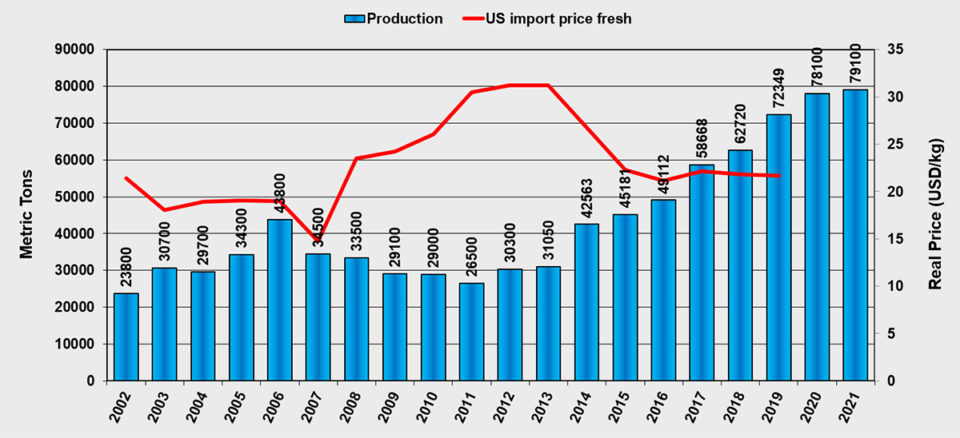
Production of bluefin tuna is expected to reach 72,000 MT this year, up 15 percent from 2018. Next year, production is expected to further grow by 8 percent to 78,000 MT. Prices for U.S. fresh imports continue to stay at levels around $22 per kg.
Groupers
Groupers appear sporadically in our annual survey, depending on our data sources, but species in this group are very important economically in many regions of the world. This year, farmed grouper production in representative countries is reported at 174,000 MT, up by 5 percent from last year. Next year, production is expected to increase by 6 percent to 185,000 MT in these representative countries.
Production of surveyed species, including carps
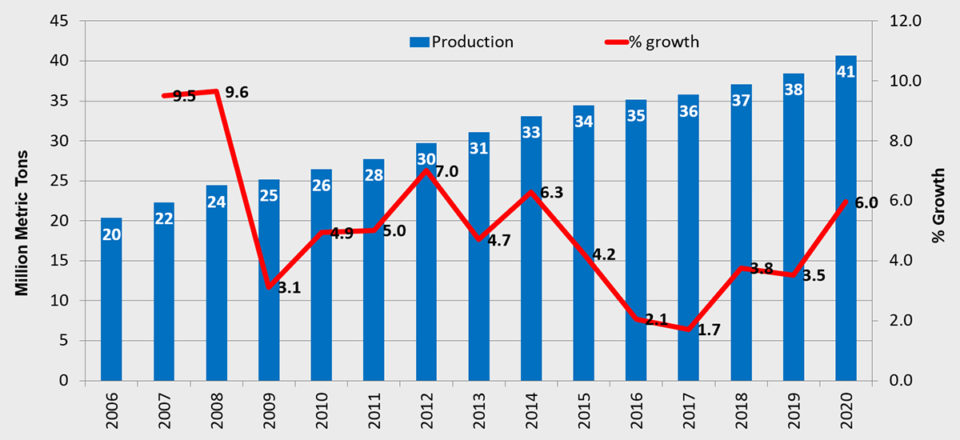
The total production of species and countries covered by our surveys are shown in Fig. 8. In 2017, our surveyed sectors covered 36 million MT of the total 53 million MT produced, according to FAO.
Production has almost doubled from the 20 million MT we reported in 2006 to an expected level of 38 million MT in 2019. Next year, production is expected to be 41 million MT.
Growth rates for all species/groups are all on the positive side. In 2017, the growth rate was 1.7 percent, then increased to 3.8 percent in 2018, is estimated at 3.5 percent in 2019 and expected to be 6 percent in 2020.
Freshwater fish represents the main bulk of production. In 2019, the freshwater sectors are predicted to produce 33 million MT, the diadromous sectors 4.6 million MT, and the marine sectors 700,000 MT.
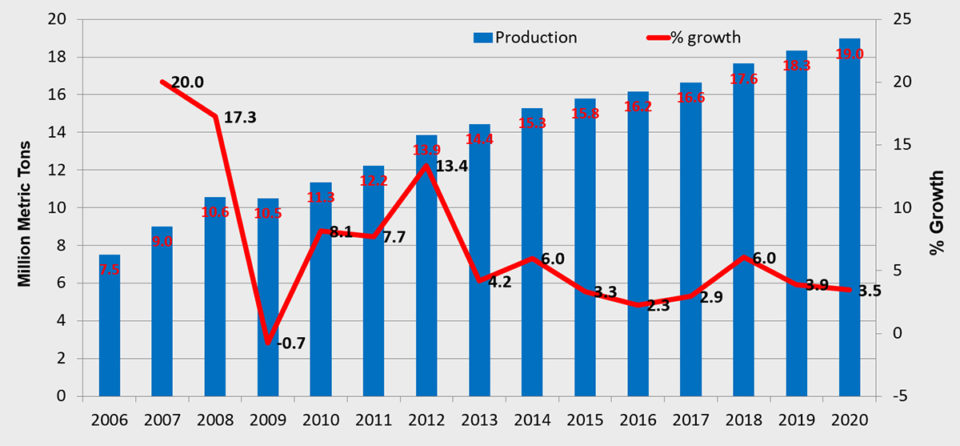
Production of surveyed species excluding carps
Next, we exclude carps. In 2017, our survey of the remaining fish species amounted to 17 million MT of the 53 million MT produced globally. Production of these species has increased from 7.5 million MT in 2006 to 18 million MT in 2019. Since 2013, production growth rates have been in the range 2 to 6 percent. In 2018, production increased by 6 percent. In 2019, it is expected to be 4 percent, with a slightly lower growth rate forecasted for next year.
When we remove carps from consideration, the production of all the other freshwater fish species we consider in our survey drops from 33 million MT to 13 million MT in 2019. However, the freshwater fish sector is still much bigger than the diadromous and marine sectors.
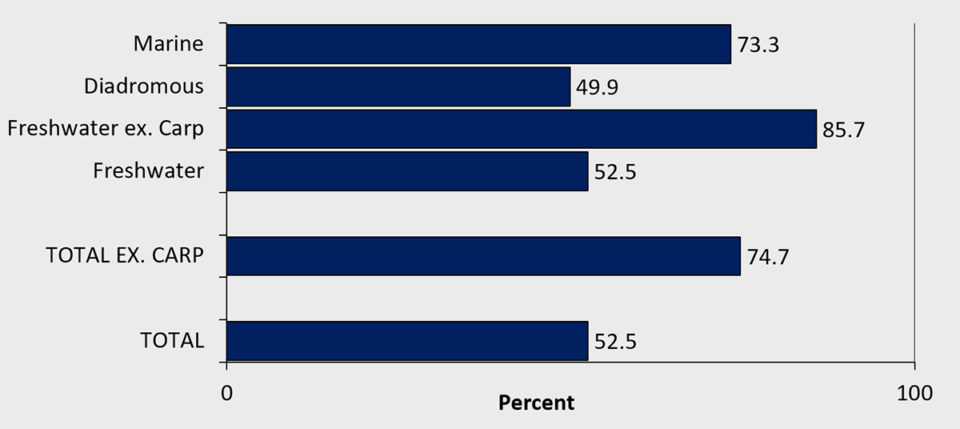
Percentage growth from 2009 to 2019
Finally, we examined the growth rate of the species groups in our survey over the last decade.
The resulting picture is mixed. Marine species had a growth of 73 percent from 2009 to 2019; diadromous species were lower at 50 percent, while freshwater fish species increased by 86 percent when we exclude carps. If we include carps, then the freshwater sectors increased production by 53 percent. The total growth rate when we include carps is at 53 percent. When we exclude carps, we see a more impressive total development for this time period, with a growth of 75 percent.
Now that you've finished reading the article ...
… we hope you’ll consider supporting our mission to document the evolution of the global aquaculture industry and share our vast network of contributors’ expansive knowledge every week.
By becoming a Global Seafood Alliance member, you’re ensuring that all of the pre-competitive work we do through member benefits, resources and events can continue. Individual membership costs just $50 a year. GSA individual and corporate members receive complimentary access to a series of GOAL virtual events beginning in April. Join now.
Not a GSA member? Join us.
Authors
-

-

Ragnar Nystoyl
Kontali Analyse AS
Industriveien 18, NO-6517 Kristiansund, Norway -

Tagged With
Related Posts

Intelligence
GOAL 2017: Global finfish production review and forecast
Global farmed fish production has increased from 19 million metric tons (MMT) in 2004 to an expected level of 44 MMT in 2017. Next year’s production is expected to be 46 MMT.

Intelligence
Global finfish production review and forecast: Nearly doubled in a decade
Farmed finfish production has more than doubled since 2005 to an expected 38 million metric tons in 2018; 2019 production is expected to remain at 38 million metric tons.

Health & Welfare
Salmon scientists collaborate on new global health initiative QASH
A cooperative effort between salmon scientists in Norway, Scotland, Chile and Canada aims to develop a globally applicable tool to help management and certification of salmon farms.

Responsibility
Weighing the risks of farming non-native fish species in India
Food security is a priority in India, and there is huge potential for the expanded culture of non-native fish species. While many farmers have improved their socio-economic conditions through farming non-native fish species, their spread into open water resources presents a threat to biodiversity.

